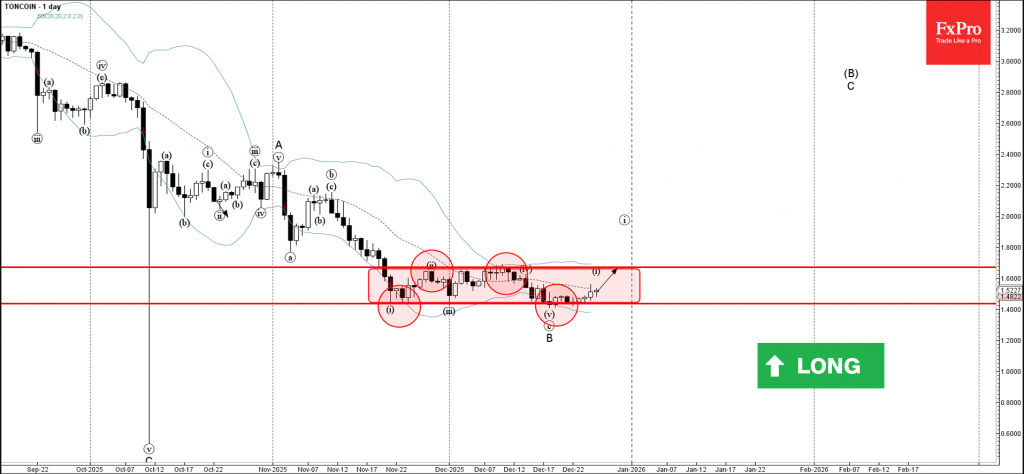
Technical analysis

Toncoin Wave Analysis – 26 December 2025

Toncoin: ⬆️ Buy

– Toncoin reversed from support zone

– Likely to rise to resistance level 1.6720

Toncoin cryptocurrency recently reversed up from the support zone between the key support level 1.4350 (lower border of the narrow sideways price range inside which the price has been trading from November).

This support level was strengthened by the intersecting lower daily Bollinger Band.

Given the strength of the support level 1.4350, Toncoin cryptocurrency can be expected to rise further to the next round resistance level 1.6720 (upper border of the active sideways price range).

The FxPro Tech Analysis Team

The FxPro technical experts prepare a daily analysis of the most active currency pairs (majors, crosses, exotics) and commodities. Selected instruments are reviewed on daily trends (D1, H4), using the active Elliott Wave setups, Japanese candlesticks, indicators, and support/resistance levels.

Share
Published by
The FxPro Tech Analysis Team
Tags: Toncoin

Recent Posts

CADJPY Wave Analysis – 26 December 2025

CADJPY: ⬆️ Buy - CADJPY broke resistance level 114.30 - Likely to rise to resistance…

2 hours ago

Nvidia Wave Analysis – 26 December 2025

Nvidia: ⬆️ Buy - Nvidia reversed from support zone - Likely to rise to resistance…

2 hours ago

Palladium Wave Analysis – 26 December 2025

Palladium: ⬆️ Buy - Palladium reversed from support zone - Likely to rise to resistance…

2 hours ago

AUDUSD Wave Analysis – 24 December 2025

AUDUSD: ⬆️ Buy - AUDUSD broke key resistance level 0.6690 - Likely to rise to…

2 days ago

Tron Wave Analysis – 24 December 2025

Tron: ⬇️ Sell - Tron reversed from resistance zone - Likely to fall to support…

2 days ago

Stellar Wave Analysis – 24 December 2025

Stellar: ⬇️ Sell - Stellar reversed from pivotal resistance level 0.2200 - Likely to fall…

2 days ago

This website uses cookies