Categories: Technical analysis

Toncoin Wave Analysis – 2 October 2025

Toncoin: ⬆️ Buy

– Toncoin reversed from support zone

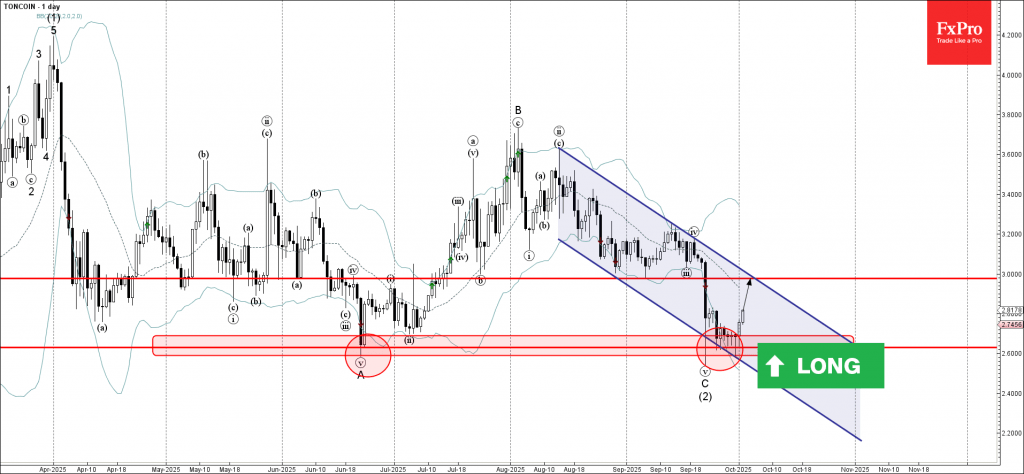
– Likely to rise to resistance level 3.000

Toncoin cryptocurrency recently reversed up with the daily Hammer from the support area between the multi-month support level 2.6000 (former multi-month low from June) and the lower daily Bollinger Band.

The support level 2.600 was strengthened by the intersecting lower support trendline of the downward sloping channel from August.

Given the strength of the support level 2.6000, Toncoin cryptocurrency can be expected to rise to the next round resistance level 3.000 (former support from July).

The FxPro Tech Analysis Team

The FxPro technical experts prepare a daily analysis of the most active currency pairs (majors, crosses, exotics) and commodities. Selected instruments are reviewed on daily trends (D1, H4), using the active Elliott Wave setups, Japanese candlesticks, indicators, and support/resistance levels.

Share
Published by
The FxPro Tech Analysis Team
Tags: Toncoin

Recent Posts

NZDCAD Wave Analysis – 7 January 2026

NZDCAD: ⬆️ Buy - NZDCAD reversed from support zone - Likely to rise to resistance…

4 hours ago

Bitcoin Wave Analysis – 7 January 2026

Bitcoin: ⬇️ Sell - Bitcoin reversed from resistance zone - Likely to fall to support…

4 hours ago

EURGBP Wave Analysis – 7 January 2026

EURGBP: ⬆️ Buy - EURGBP reversed from support zone - Likely to rise to resistance…

4 hours ago

Brent Crude Oil Wave Analysis – 7 January 2026

Brent Crude Oil: ⬇️ Sell - Brent Crude Oil reversed from resistance zone - Likely…

4 hours ago

Old fears about the euro have returned

The resurgence of the political crisis in France is weighing on EURUSD The US dollar…

13 hours ago

The crypto market has hit the upper limit of its rebound

The crypto market faces resistance at $3.2T; sentiment rises, but selling pressure persists. Bitcoin and…

15 hours ago

This website uses cookies