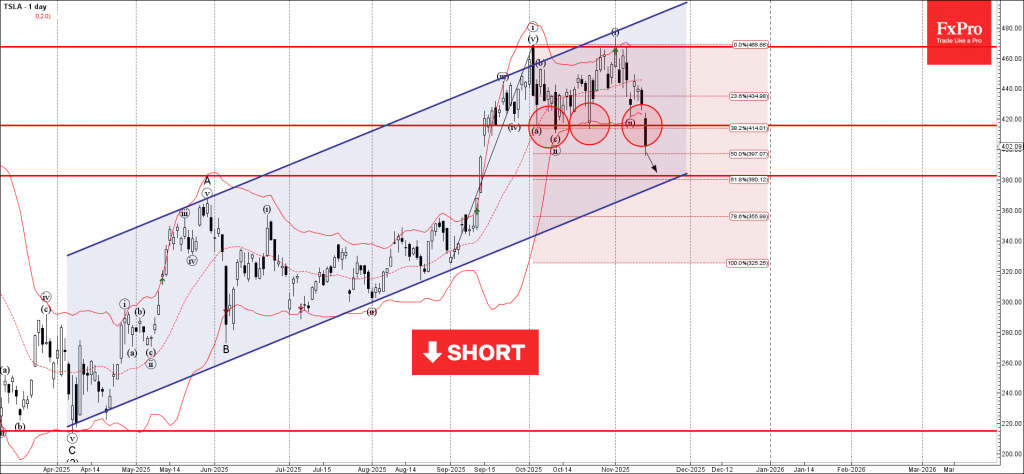
Categories: Technical analysis

Tesla Wave Analysis – 13 November 2025

Tesla: ⬇️ Sell

– Tesla broke support zone

– Likely to fall to support level 380.00,

Tesla recently broke the support zone between the support level 415.00 (which has been reversing the price from September) and the 38.2% Fibonacci correction of the upward impulse from September.

The breakout of this support zone strengthened the bearish pressure on Tesla accelerating the active impulse wave (iii).

Tesla can be expected to fall further to the next support level 380.00, which coincides with the daily up channel from April and the 61.8% Fibonacci correction of the upward impulse from September.

The FxPro Tech Analysis Team

The FxPro technical experts prepare a daily analysis of the most active currency pairs (majors, crosses, exotics) and commodities. Selected instruments are reviewed on daily trends (D1, H4), using the active Elliott Wave setups, Japanese candlesticks, indicators, and support/resistance levels.

Share
Published by
The FxPro Tech Analysis Team
Tags: Tesla

Recent Posts

CADJPY Wave Analysis – 26 December 2025

CADJPY: ⬆️ Buy - CADJPY broke resistance level 114.30 - Likely to rise to resistance…

13 hours ago

Toncoin Wave Analysis – 26 December 2025

Toncoin: ⬆️ Buy - Toncoin reversed from support zone - Likely to rise to resistance…

13 hours ago

Nvidia Wave Analysis – 26 December 2025

Nvidia: ⬆️ Buy - Nvidia reversed from support zone - Likely to rise to resistance…

13 hours ago

Palladium Wave Analysis – 26 December 2025

Palladium: ⬆️ Buy - Palladium reversed from support zone - Likely to rise to resistance…

13 hours ago

AUDUSD Wave Analysis – 24 December 2025

AUDUSD: ⬆️ Buy - AUDUSD broke key resistance level 0.6690 - Likely to rise to…

3 days ago

Tron Wave Analysis – 24 December 2025

Tron: ⬇️ Sell - Tron reversed from resistance zone - Likely to fall to support…

3 days ago

This website uses cookies