Categories: Technical analysis

Sugar Wave Analysis 3 December, 2020

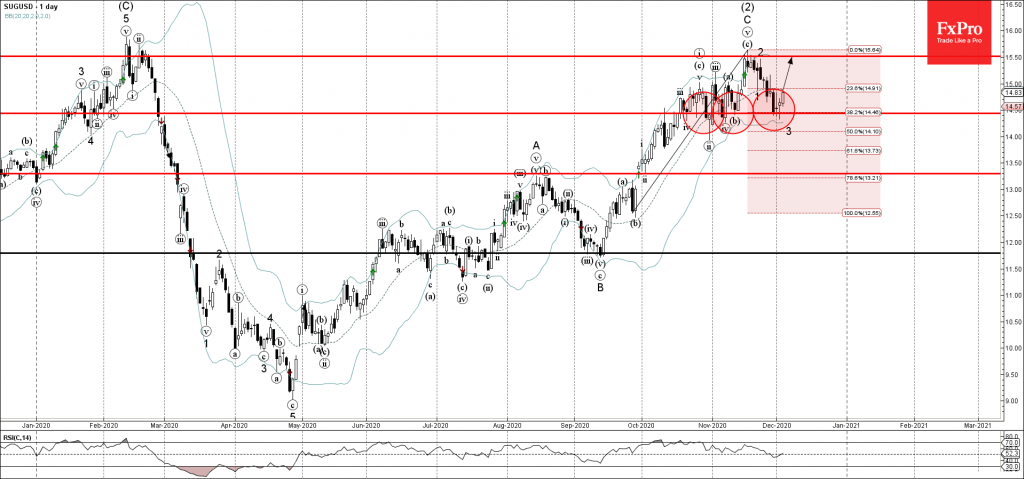
• Sugar reversed from support zone

• Likely to rise to 15.50

Sugar earlier reversed up with two daily Doji from the support zone set between the pivotal support level 14.50 (which has been reversing the price from October), lower daily Bollinger Band and the 38.2% Fibonacci correction of the upward impulse from September.

The upward reversal from this support zone stopped the earlier minor impulse wave 3.

Given the strong daily uptrend – Sugar is expected to rise further toward the next resistance level 15.50 (which reversed the price sharply in the middle of November).

The FxPro Tech Analysis Team

The FxPro technical experts prepare a daily analysis of the most active currency pairs (majors, crosses, exotics) and commodities. Selected instruments are reviewed on daily trends (D1, H4), using the active Elliott Wave setups, Japanese candlesticks, indicators, and support/resistance levels.

Share
Published by
The FxPro Tech Analysis Team
Tags: SUGUSD

Recent Posts

ADP hints at another strong NFP on Friday  

The monthly ADP labour market report showed that America created 192K new jobs in April, above…

21 hours ago

Fed’s hawkish tone risks sinking S&P500 to 4700

Bears showed strength ahead of the FOMC decision.  U.S. indices sagged on Tuesday as investors…

1 day ago

A new stage of Bitcoin’s decline

Market Picture  Bitcoin's closing price on Tuesday became the lowest since late February, confirming the…

1 day ago

Ebay Wave Analysis 30 April 2024

- Ebay under the bearish pressure - Likely to fall to support level 51.00 Ebay…

2 days ago

GBPAUD Wave Analysis 30 April 2024

- GBPAUD reversed from key support level 1.9135 - Likely to rise to resistance level…

2 days ago

Silver: a possible long road down

Silver has lost 2.6% since the start of the day on Tuesday to $26.4 per…

2 days ago

This website uses cookies