Categories: Technical analysis

Sugar Wave Analysis – 29 November , 2018

  • Sugar rising inside short-term wave 2
  • Further gains are likely

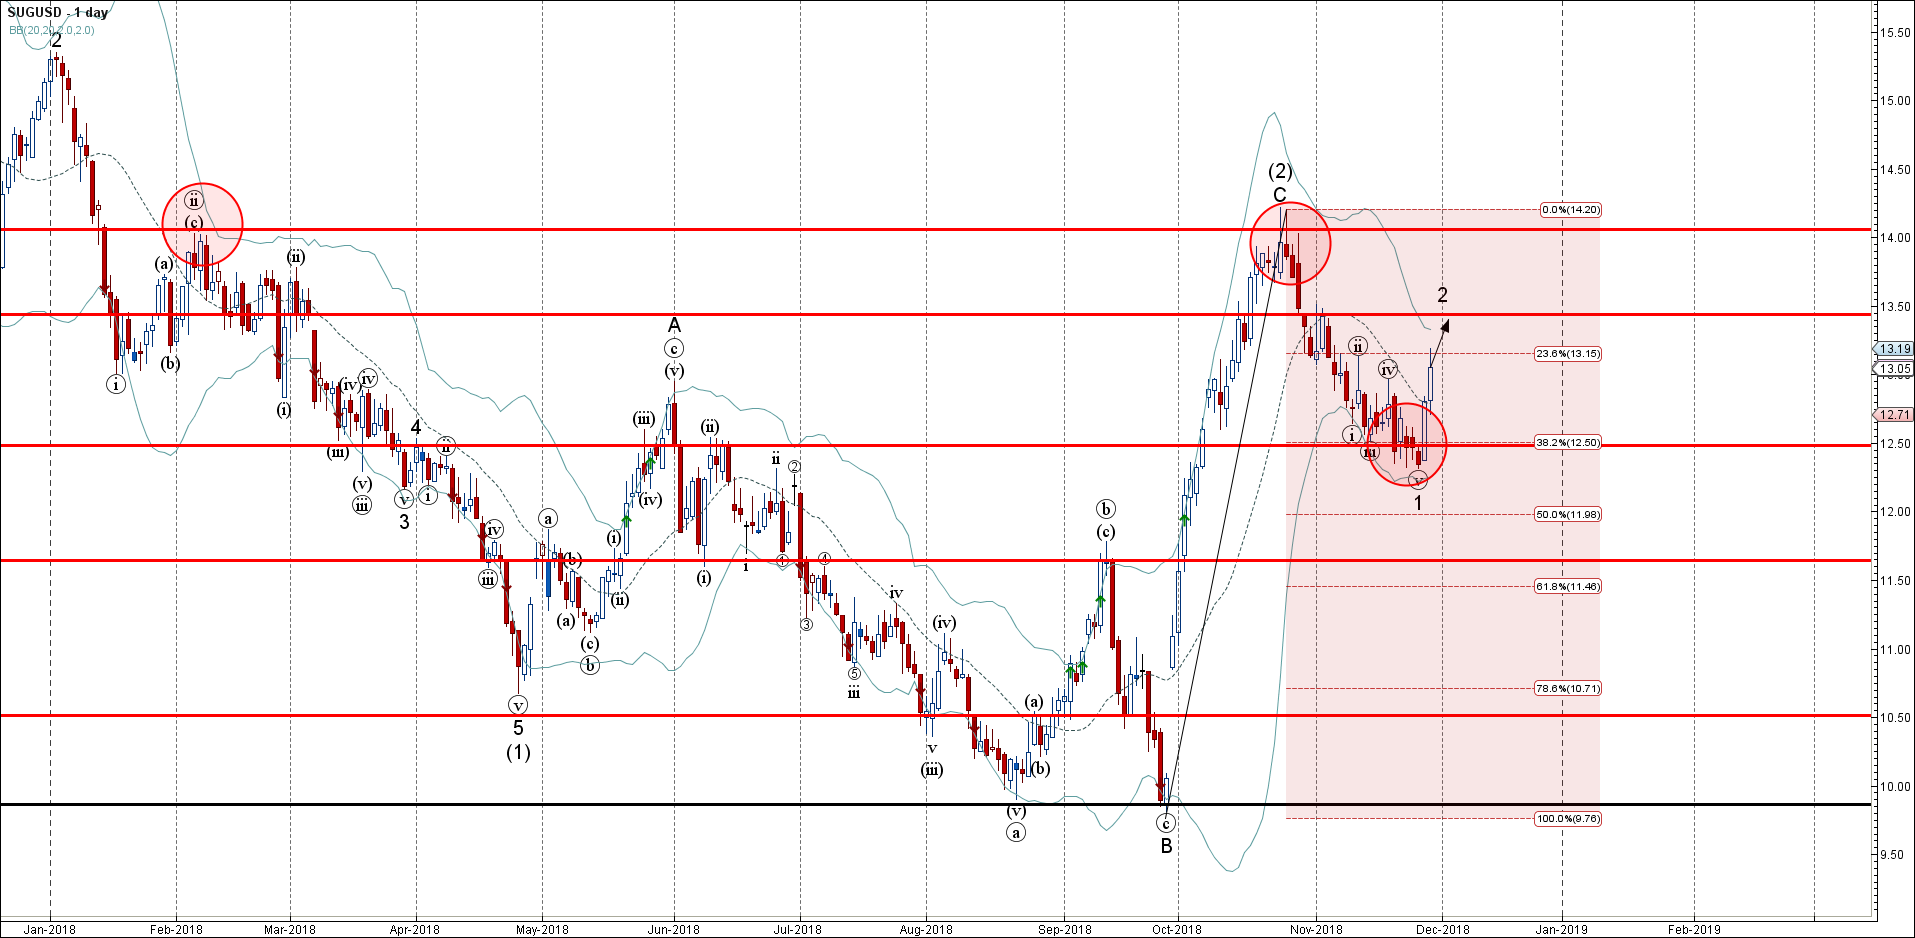
Sugar continues to rise inside the short-term corrective wave 2, which started earlier from the support area lying between the support level 12.50, lower daily Bollinger Band and the 38.2% Fibonacci correction level of the previous upward impulse wave C from September.

The active short-term corrective wave 2 belongs to the medium-term impulse wave (3) from the end of October.

Sugar is expected to rise further and re-test the next resistance level 13.50 (forecast price calculated for the completion of the active corrective wave 2).

AddThis Website Tools
The FxPro Tech Analysis Team

The FxPro technical experts prepare a daily analysis of the most active currency pairs (majors, crosses, exotics) and commodities. Selected instruments are reviewed on daily trends (D1, H4), using the active Elliott Wave setups, Japanese candlesticks, indicators, and support/resistance levels.

Share
Published by
The FxPro Tech Analysis Team
Tags: SUGUSD

Recent Posts

AMD Wave Analysis – 28 March 2025

AMD: ⬇️ Sell - AMD reversed from pivotal resistance level 115.00 - Likely to fall…

3 hours ago

Google Wave Analysis – 28 March 2025

Google: ⬇️ Sell - Google broke key support level 160.00 - Likely to fall to…

3 hours ago

Gold Wave Analysis – 28 March 2025

Gold: ⬆️ Buy - Gold broke resistance level 3050.00 - Likely to rise to resistance…

3 hours ago

Ethereum Wave Analysis – 28 March 2025

Ethereum: ⬇️ Sell - Ethereum reversed from the resistance level 2120.00 - Likely to fall…

3 hours ago

US inflation accelerates but lags income growth

US PCE inflation exceeded expectations at 2.8% in February. Income growth and savings rates remain…

8 hours ago

What is next: Australia Rate, EU CPI, US NFP

Europe will switch to daylight saving time next week. Key events include the RBA's rate…

11 hours ago