Categories: Technical analysis

Sugar Wave Analysis 18 February, 2021

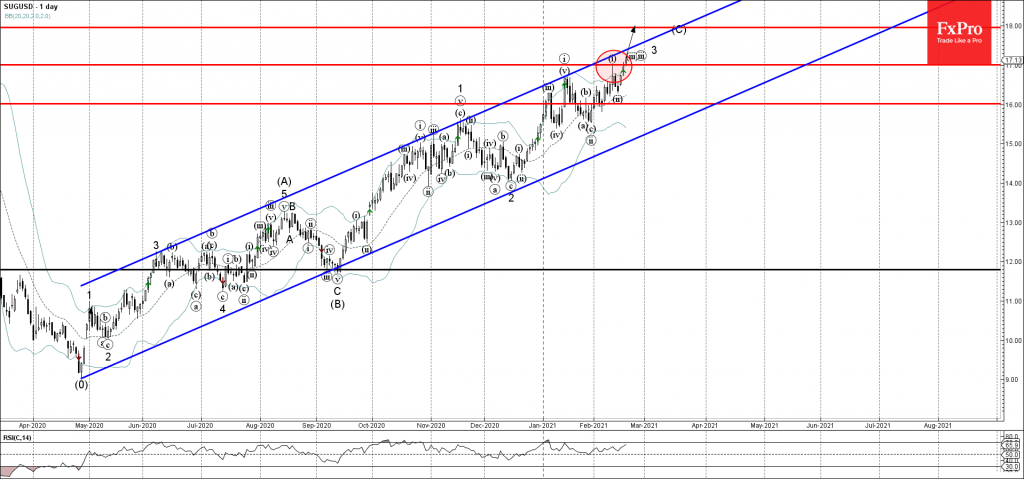
• Sugar broke the key resistance level 17.00

• Likely to rise to 18.00

Sugar recently broke the key resistance level 17.00 (which stopped the previous minor impulse wave (i) in the middle of this month).

The breakout of the resistance level 17.00 is aligned with the active multi-impulse upward impulse sequence made out of the impulse waves (iii), 3 and (C).

Given the prevailing uptrend as seen on the daily charts – Sugar can be expected to rise further toward the next resistance level 18.00 (target price for the completion of the active impulse wave (C)).

The FxPro Tech Analysis Team

The FxPro technical experts prepare a daily analysis of the most active currency pairs (majors, crosses, exotics) and commodities. Selected instruments are reviewed on daily trends (D1, H4), using the active Elliott Wave setups, Japanese candlesticks, indicators, and support/resistance levels.

Share
Published by
The FxPro Tech Analysis Team
Tags: sugar

Recent Posts

US Indices: growth widens, but are expectations too high?

Tech sell-off and high Q4 forecasts put the S&P 500 at risk; the Russell 2000…

33 minutes ago

Markets pick up signals from the White House

Donald Trump has no intention of dismissing Jerome Powell. The White House's decision to postpone…

4 hours ago

Nat Gas Current situation #tradelikeapro #tradingshort #tradingtips #gas #tradingstrategy #trading

Today is Thursday, January 15th. Once again we will talk about the gas market. The…

4 hours ago

Bitcoin aims to break out of a corrective rebound

Crypto market rebounds, Bitcoin eyes $100K, Dash surges, institutional demand rises, and Ethereum staking hits…

4 hours ago

Bitcoin Wave Analysis – 14 January 2026

Bitcoin: ⬆️ Buy - Bitcoin broke resistance area - Likely to rise to resistance level…

19 hours ago

NZDJPY Wave Analysis – 14 January 2026

NZDJPY: ⬇️ Sell - NZDJPY reversed down from the resistance area - Likely to fall…

19 hours ago

This website uses cookies