Categories: Technical analysis

Sugar Wave Analysis – 17 May, 2019

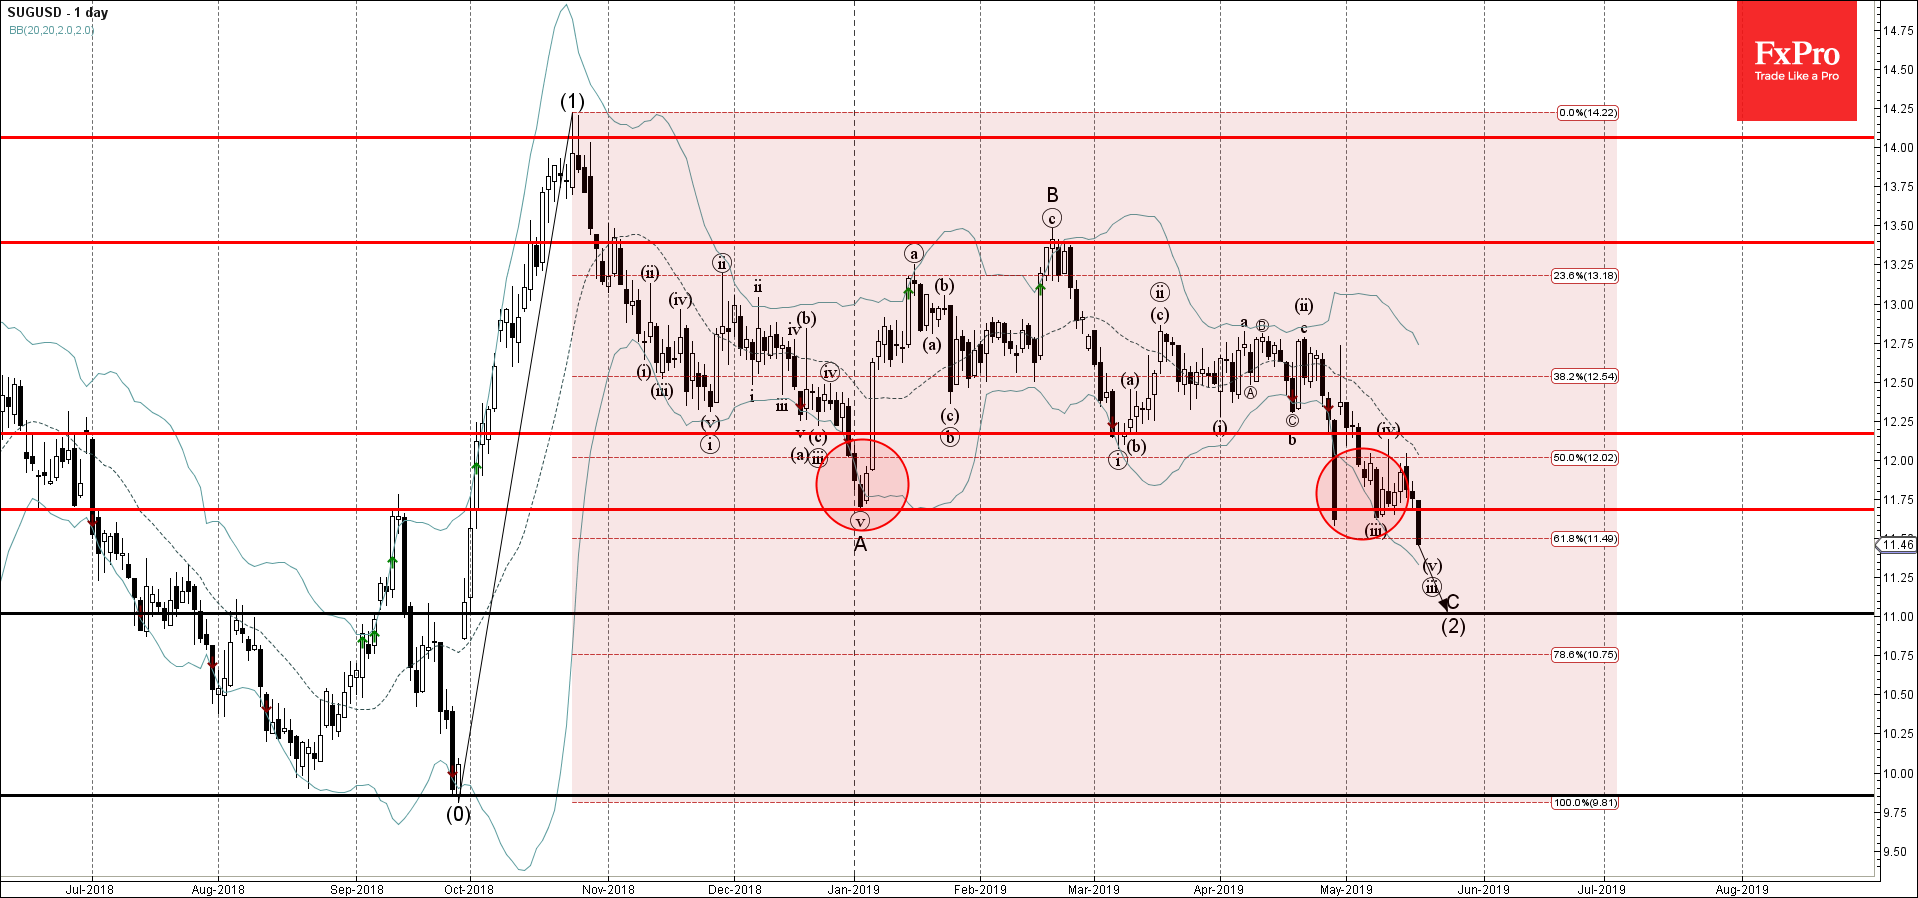
  • Sugar broke strong the support level 11.75
  • Further losses are likely

Sugar under pressure after the earlier breakout of strong the support level 11.75 (which has been reversing the price from January).

This breakout of the support level 11.75 should accelerate the active impulse wave C of the medium-term ABC correction (2) from October.

Sugar is expected to fall further and retest the next support level 11.00 (forecast price for the completion of the active impulse wave C).

The FxPro Tech Analysis Team

The FxPro technical experts prepare a daily analysis of the most active currency pairs (majors, crosses, exotics) and commodities. Selected instruments are reviewed on daily trends (D1, H4), using the active Elliott Wave setups, Japanese candlesticks, indicators, and support/resistance levels.

Share
Published by
The FxPro Tech Analysis Team
Tags: SUGUSD

Recent Posts

Apple Wave Analysis – 9 April 2025

Apple: ⬆️ Buy - Apple reversed from the support zone - Likely to rise to…

11 hours ago

EURGBP Wave Analysis – 9 April 2025

EURGBP: ⬆️ Buy - EURGBP broke the resistance zone - Likely to rise to resistance…

11 hours ago

Dollar pressured as markets are betting on a dovish Fed

The selling pressure on the US dollar is due to the sell-off in equities and…

12 hours ago

The crypto market has returned to this week’s lows

Crypto market cap fell 2% to $2.46 trillion in 24 hours, retesting the $2.40 trillion…

15 hours ago

Video: Bitcoin in Crisis. Will Crypto Bounce Back or Crash?

Bitcoin’s struggle continues, and the market’s rebound might not last. But what’s really driving the…

19 hours ago

GBPCHF Wave Analysis – 8 April 2025

GBPCHF: ⬇️ Sell - GBPCHF broke the support zone - Likely to fall to support…

1 day ago

This website uses cookies