Categories: Technical analysis

Sugar Wave Analysis – 17 July, 2019

  • Sugar broke support area
  • Further losses are likely

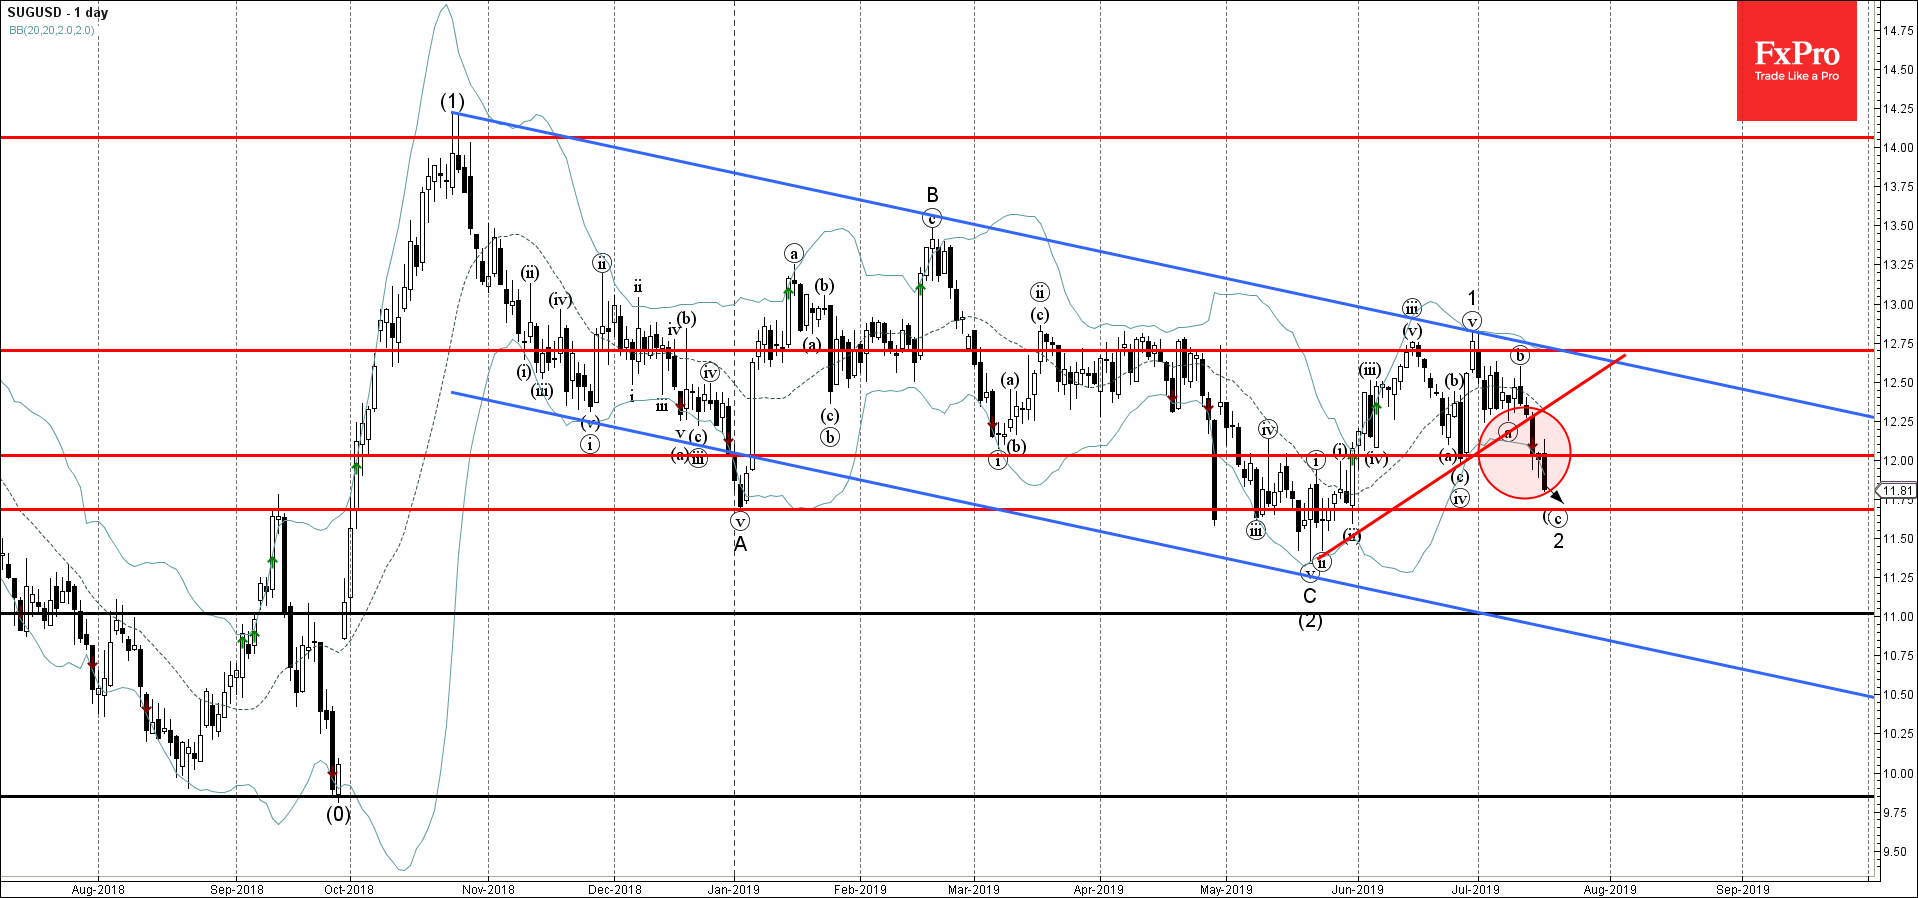
Sugar recently broke the support area lying between the key support level 12.00 (monthly low from June) and the support trendline from the middle of May.

The breakout of this support area accelerated the active short-term waves (c) and 2.

Sugar is expected to fall further and retest the next support level 11.70 (target for the completion of the active ABC correction 2).

The FxPro Tech Analysis Team

The FxPro technical experts prepare a daily analysis of the most active currency pairs (majors, crosses, exotics) and commodities. Selected instruments are reviewed on daily trends (D1, H4), using the active Elliott Wave setups, Japanese candlesticks, indicators, and support/resistance levels.

Share
Published by
The FxPro Tech Analysis Team
Tags: SUGUSD

Recent Posts

Forex has set its priorities

In 2026, experts favour the yen, see modest euro growth, and expect pressure on the…

3 hours ago

Bear market rebound in crypto is likely to continue

Crypto rebounds continue; Bitcoin faces resistance, with a mixed market outlook ahead, as regulatory changes…

4 hours ago

Coca-Cola Wave Analysis – 4 December 2025

Coca-Cola: ⬇️ Sell - Coca-Cola reversed from long-term resistance level 73.25 - Likely to fall to…

17 hours ago

DraftKings Wave Analysis – 4 December 2025

DraftKings: ⬆️ Buy - DraftKings reversed from support zone - Likely to rise to resistance level…

17 hours ago

NVDA Wave Analysis – 4 December 2025

NVDA: ⬆️ Buy - NVDA reversed from support zone - Likely to rise to resistance level…

18 hours ago

Basic Attention Token Wave Analysis – 4 December 2025

Basic Attention Token: ⬇️ Sell - Basic Attention Token reversed from resistance level 0.2800 - Likely…

18 hours ago

This website uses cookies