Categories: Technical analysis

Sugar Wave Analysis – 17 February, 2020

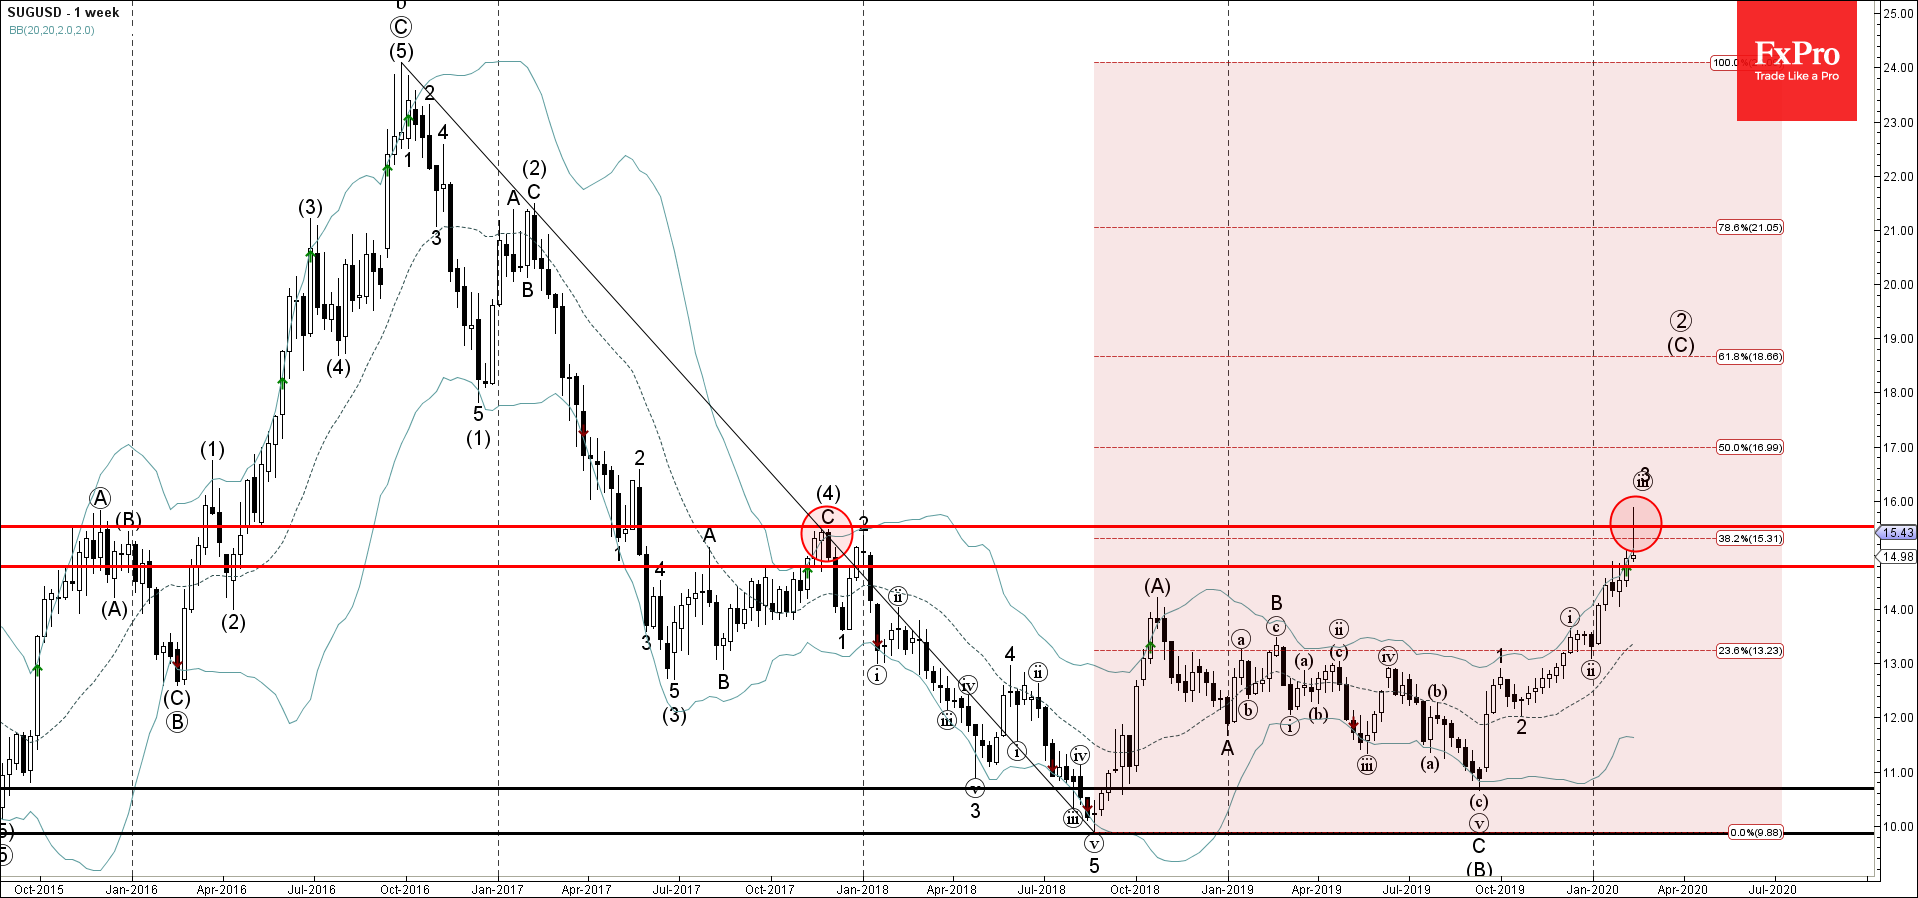
  • Sugar reversed from resistance area
  • Likely to fall to 15.00

Sugar previously reversed down sharply from the resistance area lying between the multi-year resistance level 15.50 (which stopped the price at the end of 2017), upper weekly Bollinger Band and the 38,2% Fibonacci retracement of the previous weekly downward impulse from July of 2016.

The downward reversal from this from the resistance area stopped the previous impulse waves 3 and (C).

Given the strength of the aforementioned resistance area – Sugar is likely to correct down further toward the next support level 15.00.

AddThis Website Tools
The FxPro Tech Analysis Team

The FxPro technical experts prepare a daily analysis of the most active currency pairs (majors, crosses, exotics) and commodities. Selected instruments are reviewed on daily trends (D1, H4), using the active Elliott Wave setups, Japanese candlesticks, indicators, and support/resistance levels.

Share
Published by
The FxPro Tech Analysis Team
Tags: SUGUSD

Recent Posts

Tesla Wave Analysis – 21 March 2025

Tesla: ⬆️ Buy - Tesla reversed from support level 220.00 - Likely to rise to…

16 hours ago

Google Wave Analysis – 21 March 2025

Google: ⬆️ Buy - Google reversed from key support level 160.00 - Likely to rise…

16 hours ago

Silver Wave Analysis – 21 March 2025

Silver: ⬇️ Sell - Silver reversed from resistance level 34.00 - Likely to fall to…

17 hours ago

USDCHF Wave Analysis – 21 March 2025

USDCHF: ⬆️ Buy - USDCHF reversed from support level 0,8750 - Likely to fall to…

18 hours ago

What’s next: Flash PMIs, UK CPI & US PCE

The week ahead includes the release of the PMI business activity indexes for March, the…

1 day ago

Gold: Growth Opportunities

Gold has been in an uptrend, reaching record highs and offering growth opportunities. However, caution…

1 day ago