Categories: Technical analysis

Sugar Wave Analysis – 15 January, 2019

  • Sugar reversed from key resistance level 1.5280
  • Further losses are likely

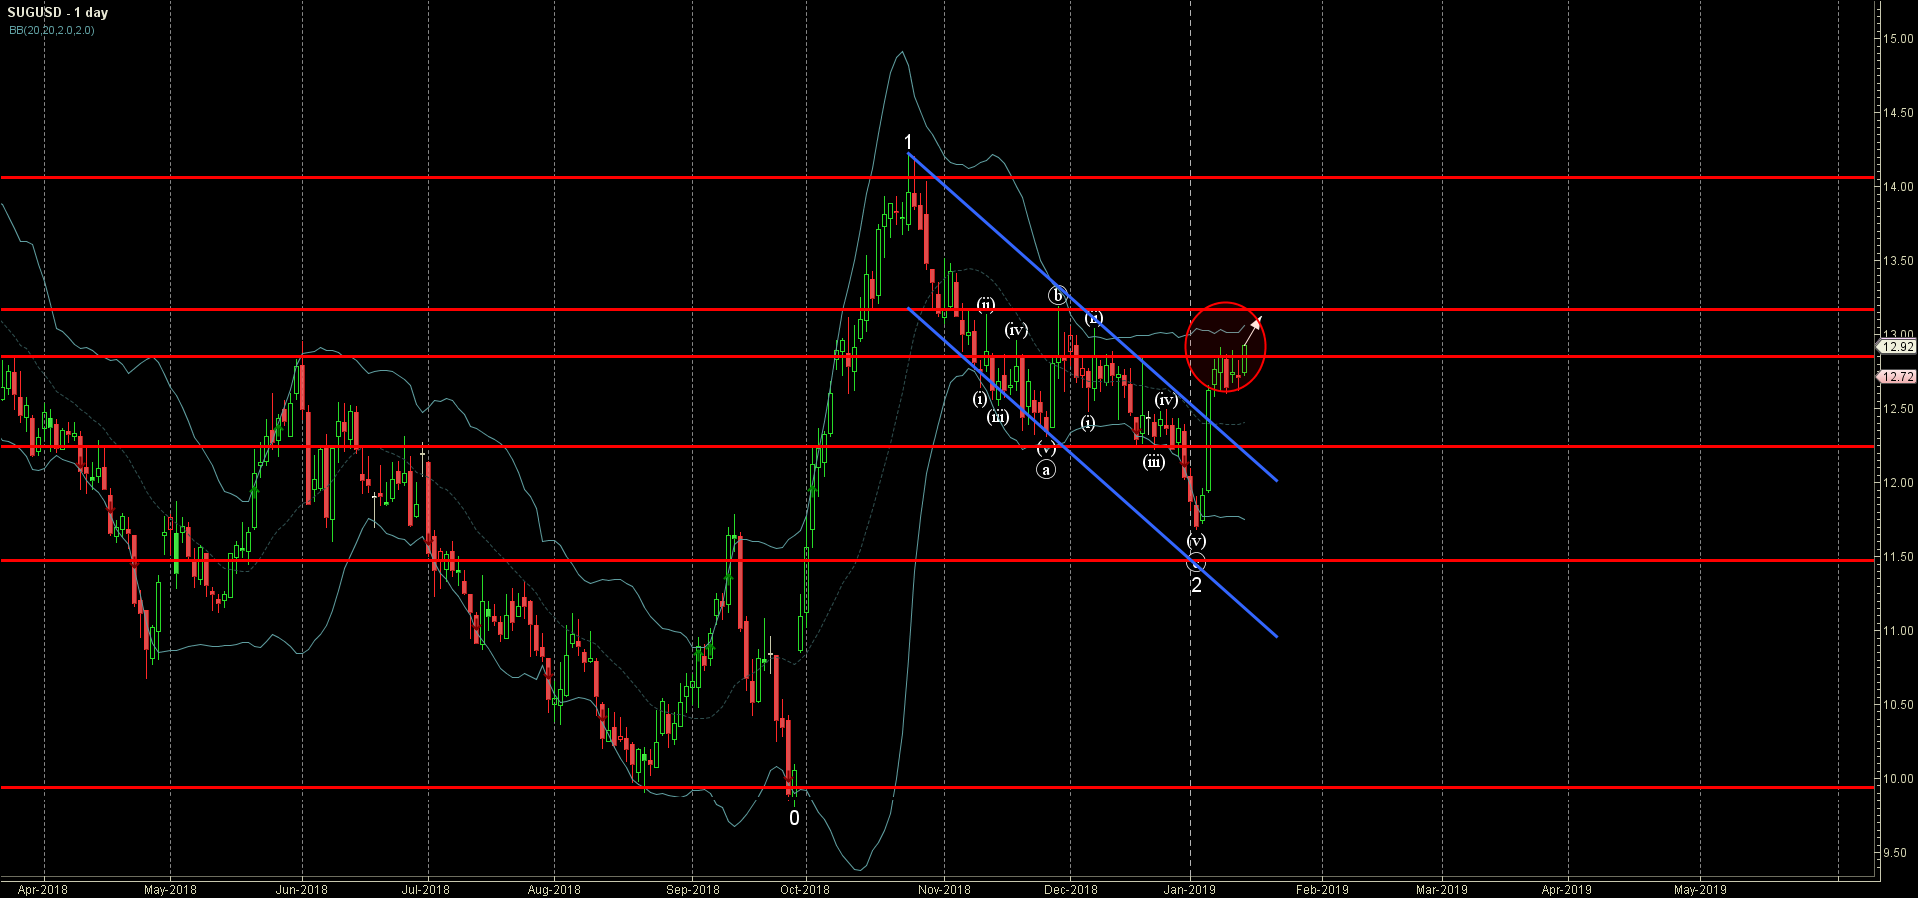
Sugar today broke the pivotal resistance level 1.5280 (top of the Falling Star from December) – which was proceeding by the breakout of the resistance trendline of the daily down channel from October.

The breakout of the resistance level 1.5280 should accelerate the active short-term impulse wave 3 from the start of January.

Sugar is expected to rise further and re-test the next resistance level 13.20 (top of the previous corrective wave (b) from the end of November).

The FxPro Tech Analysis Team

The FxPro technical experts prepare a daily analysis of the most active currency pairs (majors, crosses, exotics) and commodities. Selected instruments are reviewed on daily trends (D1, H4), using the active Elliott Wave setups, Japanese candlesticks, indicators, and support/resistance levels.

Share
Published by
The FxPro Tech Analysis Team
Tags: SUGUSD

Recent Posts

CHFJPY Wave Analysis – 9 January 2026

CHFJPY: ⬆️ Buy - CHFJPY reversed from support area - Likely to rise to resistance…

2 days ago

Exxon Mobil Wave Analysis – 9 January 2026

Exxon Mobil: ⬆️ Buy - Exxon Mobil reversed from support area - Likely to rise…

2 days ago

Pro News Weekly: Dollar Rebounds as Markets Test New Limits

Welcome to Pro News Weekly! Here’s what is shaping the markets: 💵 The U.S. dollar…

2 days ago

Geopolitics will destroy the euro

•    EURUSD falls due to geopolitics and expectations of tariff removal •    Gold returns to…

2 days ago

Platinum Wave Analysis – 8 January 2026

Platinum: ⬇️ Sell - Platinum reversed from pivotal resistance level 150.00 - Likely to fall to…

3 days ago

Baidu Wave Analysis – 8 January 2026

Baidu: ⬇️ Sell - Baidu reversed from resistance zone - Likely to fall to support level…

3 days ago

This website uses cookies