Categories: Technical analysis

Sugar Wave Analysis 11 February, 2021

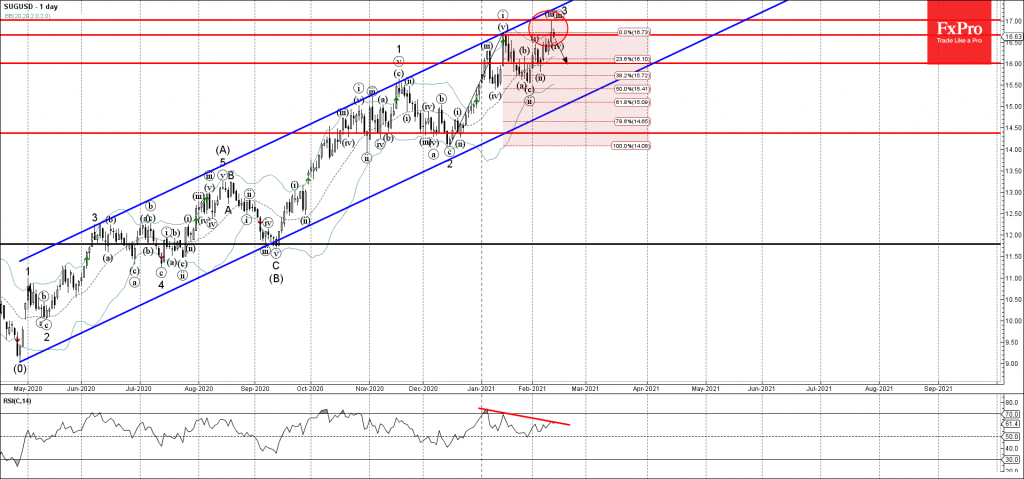
• Sugar reversed from resistance level 16.65

• Likely to correct down to 16.00

Sugar under bearish pressure after the price failed to hold the ground above the resistance level 16.65 (which stopped the previous impulse wave (i) in December).

The resistance area near the resistance level 16.65 was strengthened by the upper daily Bollinger band. The downward reversal form resistance level 16.65 started the active correction (iv).

Given the clear bearish divergence on the daily RSI indicator  – Sugar can be expected to fall further toward the next support level 16.00.

The FxPro Tech Analysis Team

The FxPro technical experts prepare a daily analysis of the most active currency pairs (majors, crosses, exotics) and commodities. Selected instruments are reviewed on daily trends (D1, H4), using the active Elliott Wave setups, Japanese candlesticks, indicators, and support/resistance levels.

Share
Published by
The FxPro Tech Analysis Team
Tags: sugar

Recent Posts

Silver: a possible long road down  

Silver has lost 2.6% since the start of the day on Tuesday to $26.4 per…

3 hours ago

Another Dip in Crypto Capitalization

Market picture  The crypto market capitalisation decreased by another 1.5% to $2.27 trillion, getting closer…

6 hours ago

ANF Wave Analysis 29 April 2024

ANF reversed from key support level 113.40 Likely to rise to resistance level 132.31 ANF…

22 hours ago

GBPUSD Wave Analysis 29 April 2024

- GBPUSD rising inside minor correction 2 - Likely to rise to resistance level 1.2700…

22 hours ago

Crypto Market Retreats Due to Overhang of Sellers

Market picture The crypto market has lost 3.3% in the last 24 hours to $2.3…

1 day ago

USDJPY Wave Analysis 26 April 2024

- USDJPY broke key resistance level 155.00 - Likely to rise to resistance level 160.00…

4 days ago

This website uses cookies