Categories: Technical analysis

Sugar Wave Analysis – 02 March, 2020

  • Sugar broke support area
  • Likely to fall to 13.60

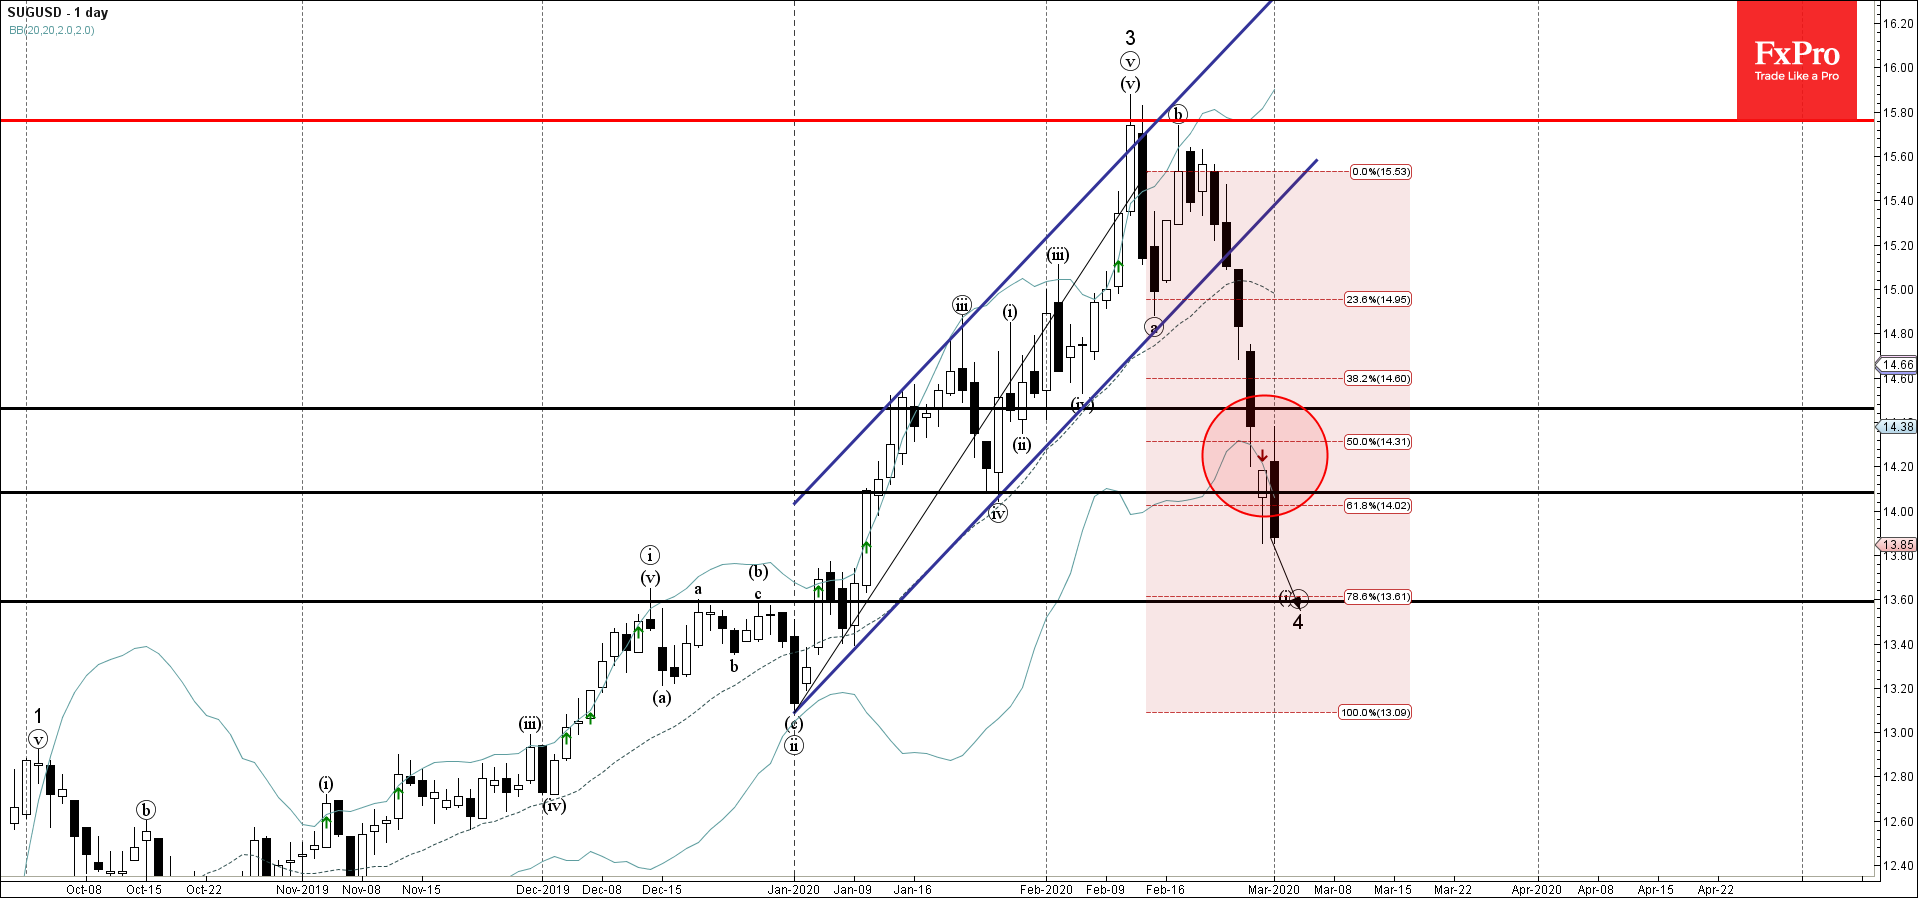
Sugar recently broke through the support area lying between the support levels 14.45, 14.10 (low of the previous downward correction (iv)) and the 61.8% Fibonacci retracement of the previous upward impulse from January.

The breakout of this support area accelerated the active short-term ABC correction 4.

Sugar is likely to fall further toward the next support level 13.60 (forecast price calculated for the completion of the active ABC correction 4).

AddThis Website Tools
The FxPro Tech Analysis Team

The FxPro technical experts prepare a daily analysis of the most active currency pairs (majors, crosses, exotics) and commodities. Selected instruments are reviewed on daily trends (D1, H4), using the active Elliott Wave setups, Japanese candlesticks, indicators, and support/resistance levels.

Share
Published by
The FxPro Tech Analysis Team
Tags: SUGUSD

Recent Posts

US inflation accelerates but lags income growth

US PCE inflation exceeded expectations at 2.8% in February. Income growth and savings rates remain…

1 hour ago

What is next: Australia Rate, EU CPI, US NFP

Europe will switch to daylight saving time next week. Key events include the RBA's rate…

4 hours ago

Dollar under tariffs pressure

The US dollar showed a hesitant upward trend, facing resistance as it approached technical obstacles.

6 hours ago

Pfizer Wave Analysis – 27 March 2025

Pfizer: ⬇️ Sell - Pfizer broke support level 25.20 - Likely to fall to support level…

19 hours ago

Silver Wave Analysis – 27 March 2025

Silver: ⬆️ Buy - Silver broke resistance area - Likely to rise to resistance level…

19 hours ago

EURGBP Wave Analysis – 27 March 2025

EURGBP: ⬇️ Sell - EURGBP broke support area - Likely to fall to support level…

23 hours ago