Categories: Technical analysis

S&P 500 Wave Analysis 7 May 2024

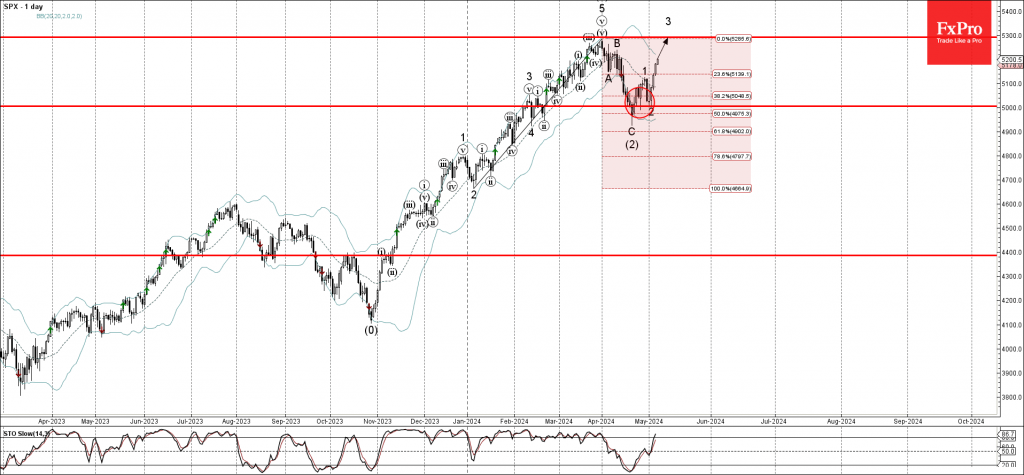
– S&P 500 reversed from support level 5000.00

– Likely to rise to resistance level 5300.00

S&P 500 index recently reversed up from the support zone lying between the round support level 5000.00 (which also stopped the previous correction (2)), lower daily Bollinger Band and the 50% Fibonacci correction of the upward impulse from January.

The upward reversal from the support level 5000.00 stopped the previous short-term correction 2.

Given the strong uptrend that can be seen on the daily charts, S&P 500 index can be expected to rise further to the next resistance level 5300.00 (which stopped the previous impulse wave 5 at the end of March).

The FxPro Tech Analysis Team

The FxPro technical experts prepare a daily analysis of the most active currency pairs (majors, crosses, exotics) and commodities. Selected instruments are reviewed on daily trends (D1, H4), using the active Elliott Wave setups, Japanese candlesticks, indicators, and support/resistance levels.

Share
Published by
The FxPro Tech Analysis Team
Tags: S&P 500

Recent Posts

CHFJPY Wave Analysis – 9 January 2026

CHFJPY: ⬆️ Buy - CHFJPY reversed from support area - Likely to rise to resistance…

1 day ago

Exxon Mobil Wave Analysis – 9 January 2026

Exxon Mobil: ⬆️ Buy - Exxon Mobil reversed from support area - Likely to rise…

1 day ago

Pro News Weekly: Dollar Rebounds as Markets Test New Limits

Welcome to Pro News Weekly! Here’s what is shaping the markets: 💵 The U.S. dollar…

1 day ago

Geopolitics will destroy the euro

•    EURUSD falls due to geopolitics and expectations of tariff removal •    Gold returns to…

2 days ago

Platinum Wave Analysis – 8 January 2026

Platinum: ⬇️ Sell - Platinum reversed from pivotal resistance level 150.00 - Likely to fall to…

2 days ago

Baidu Wave Analysis – 8 January 2026

Baidu: ⬇️ Sell - Baidu reversed from resistance zone - Likely to fall to support level…

2 days ago

This website uses cookies