Categories: Technical analysis

S&P 500 Wave Analysis 5 November 2024

– S&P 500 reversed from support area

– Likely to rise to resistance level 5850.00

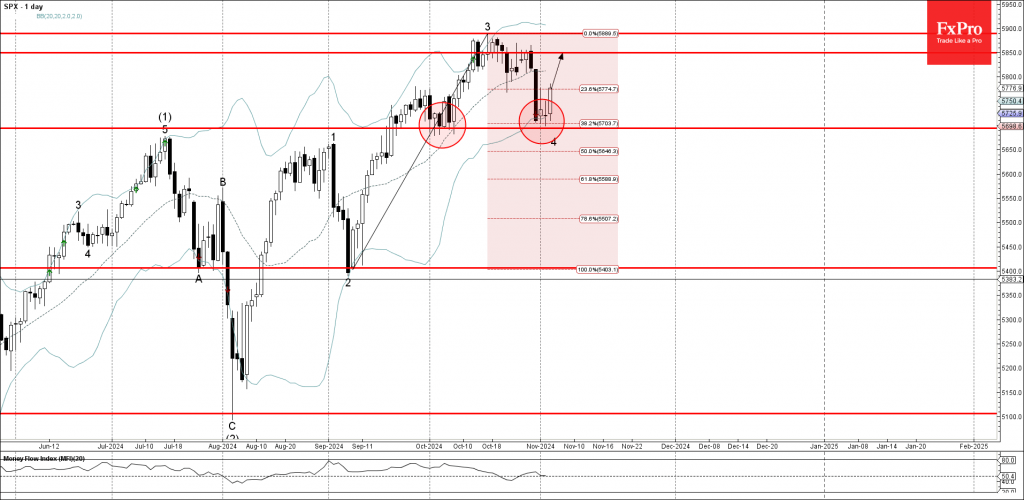
S&P 500 index earlier reversed up from the support area located between the key support level 5695.00 (which reversed the index for 7 consecutive days at the start of October) and the lower daily Bollinger Band.

This support area was further strengthened by the 38.2% Fibonacci correction of the sharp upward impulse from the start of September.

Given the clear daily uptrend, S&P 500 index can be expected to rise further to the next resistance level 5850.00 (former minor resistance from the end of October).

The FxPro Tech Analysis Team

The FxPro technical experts prepare a daily analysis of the most active currency pairs (majors, crosses, exotics) and commodities. Selected instruments are reviewed on daily trends (D1, H4), using the active Elliott Wave setups, Japanese candlesticks, indicators, and support/resistance levels.

Share
Published by
The FxPro Tech Analysis Team
Tags: spx

Recent Posts

Forex has set its priorities

In 2026, experts favour the yen, see modest euro growth, and expect pressure on the…

4 hours ago

Bear market rebound in crypto is likely to continue

Crypto rebounds continue; Bitcoin faces resistance, with a mixed market outlook ahead, as regulatory changes…

5 hours ago

Coca-Cola Wave Analysis – 4 December 2025

Coca-Cola: ⬇️ Sell - Coca-Cola reversed from long-term resistance level 73.25 - Likely to fall to…

18 hours ago

DraftKings Wave Analysis – 4 December 2025

DraftKings: ⬆️ Buy - DraftKings reversed from support zone - Likely to rise to resistance level…

18 hours ago

NVDA Wave Analysis – 4 December 2025

NVDA: ⬆️ Buy - NVDA reversed from support zone - Likely to rise to resistance level…

19 hours ago

Basic Attention Token Wave Analysis – 4 December 2025

Basic Attention Token: ⬇️ Sell - Basic Attention Token reversed from resistance level 0.2800 - Likely…

20 hours ago

This website uses cookies