Financial data analysis graph showing stock market trends on a trading board. Horizontal composition with copy space and selective focus.
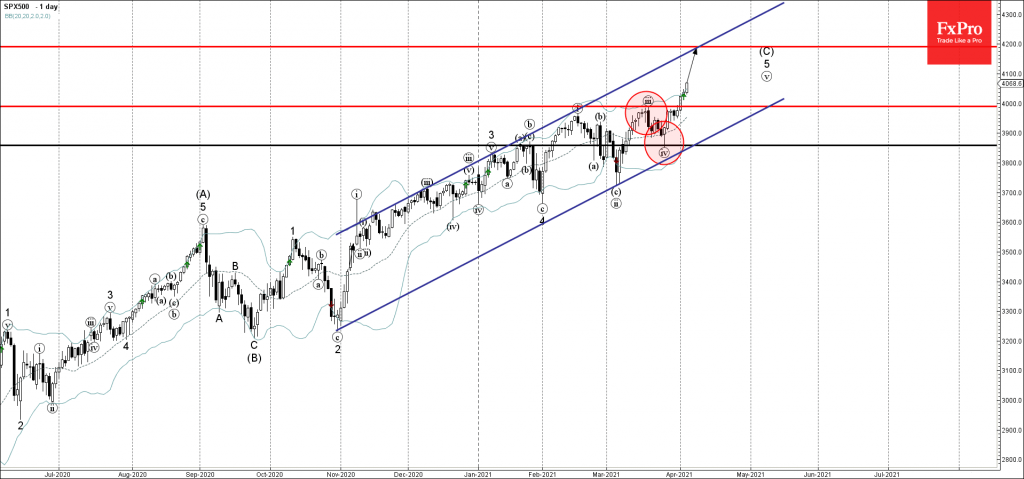
• S&P 500 broke round resistance level 4000.00
• Likely to rise to resistance level 4200.00
S&P 500 index recently broke above the key round resistance level 4000.00 (which stopped the earlier impulse wave (iii) in March).
The breakout of the resistance level 4000.00 accelerated the active impulse waves (v), 5 and (C).
Given the strong daily uptrend – S&P 500 index is likely to rise further toward the next resistance level 4200.00 (target for the completion of the active impulse wave (C)).
Bitcoin: ⬆️ Buy - Bitcoin broke resistance area - Likely to rise to resistance level…
NZDJPY: ⬇️ Sell - NZDJPY reversed down from the resistance area - Likely to fall…
Leverage is a mechanism that lets traders control larger positions using smaller capital. By choosing…
US GDP growth is driven not by the White House, but by AI. The Bank…
The crypto market surges, hitting new highs, with bullish sentiment for Bitcoin and Ethereum amid…
Brent Crude oil ⬆️ Buy - Brent Crude oil rising inside impulse wave c -…
This website uses cookies