Categories: Technical analysis

S&P 500 Wave Analysis 4 October 2024

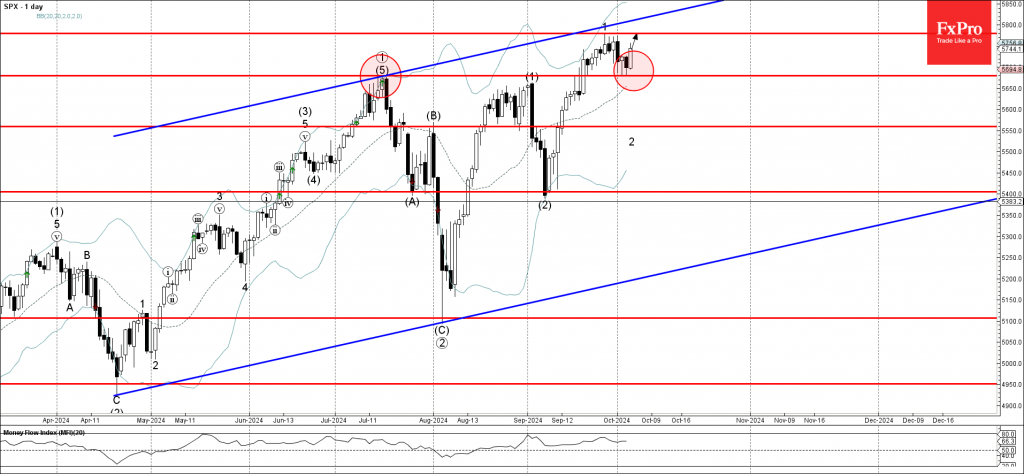
– S&P 500 reversed from support level 5680.00

– Likely to rise to resistance level 5780.00

S&P 500 index recently reversed up from the pivotal support level 5680.00 (a former multi-month high from July, acting as the support after it was broken last month).

The upward reversal from the support level 5680.00 will likely form the daily Japanese candlesticks reversal pattern Bullish Engulfing – if the index closes today near the current levels.

Given the clear daily uptrend, S&P 500 index can be expected to rise further to the next resistance level 5780.00 (top of the impulse wave 1 from last month).

AddThis Website Tools
The FxPro Tech Analysis Team

The FxPro technical experts prepare a daily analysis of the most active currency pairs (majors, crosses, exotics) and commodities. Selected instruments are reviewed on daily trends (D1, H4), using the active Elliott Wave setups, Japanese candlesticks, indicators, and support/resistance levels.

Share
Published by
The FxPro Tech Analysis Team
Tags: S&P 500

Recent Posts

Adobe Wave Analysis – 13 March 2025

Adobe: ⬇️ Sell - Adobe broke round support level 400.00 - Likely to fall to…

3 hours ago

Apple Wave Analysis – 13 March 2025

Apple: ⬇️ Sell - Apple broke support area - Likely to fall to support level…

3 hours ago

Gold Wave Analysis – 13 March 2025

Gold: ⬆️ Buy - Gold broke resistance level 2962.00 - Likely to rise to resistance…

4 hours ago

EURGBP Wave Analysis – 13 March 2025

EURGBP: ⬇️ Sell - EURGBP reversed from key resistance level 0.8450 - Likely to fall…

4 hours ago

Gold climbs on lower rate speculations

The gold price has resumed updating its all-time highs on the back of speculations around…

10 hours ago

Crypto: just a bumpy downtrend

The crypto market experienced a drop, but towards the end of the week, there was…

11 hours ago