Categories: Technical analysis

S&P 500 Wave Analysis – 26 September 2025

S&P 500: ⬆️ Buy

– &P 500 index reversed from support level 6600.00

– Likely to rise to resistance level 6700.00

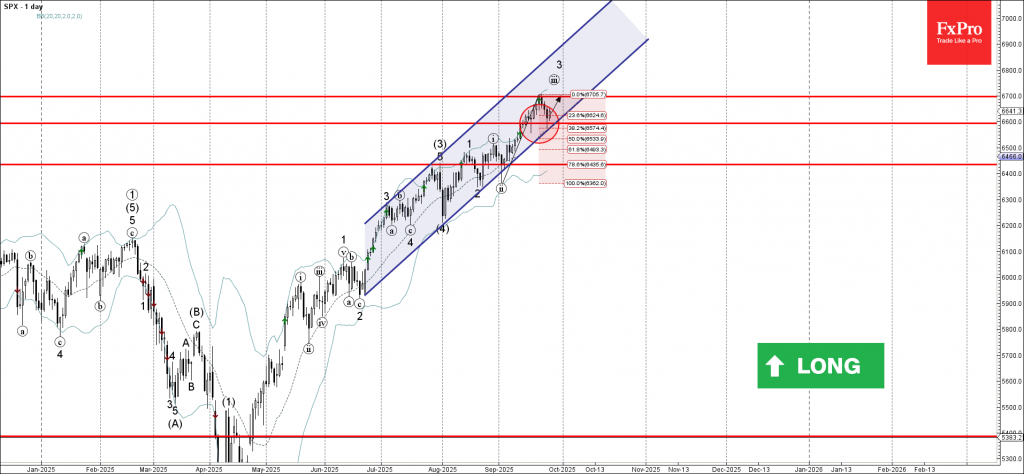
S&P 500 index recently reversed up from the key support level 6600.00 (which also reversed the index in the middle of September) coinciding with the 20-day moving average and the 38.2% Fibonacci correction of the upward impulse from last month.

The upward reversal from the support level 6600.00 continues the active short-term impulse wave 3 of the intermediate impulse wave (5) from the start of August.

Given the strong daily uptrend, S&P 500 index can be expected to rise further to the next resistance level 6700.00 (which reversed the price earlier this month).

The FxPro Tech Analysis Team

The FxPro technical experts prepare a daily analysis of the most active currency pairs (majors, crosses, exotics) and commodities. Selected instruments are reviewed on daily trends (D1, H4), using the active Elliott Wave setups, Japanese candlesticks, indicators, and support/resistance levels.

Share
Published by
The FxPro Tech Analysis Team
Tags: sxp

Recent Posts

Pro News Weekly: Dollar Rebounds as Markets Test New Limits

Welcome to Pro News Weekly! Here’s what is shaping the markets: 💵 The U.S. dollar…

4 hours ago

Geopolitics will destroy the euro

•    EURUSD falls due to geopolitics and expectations of tariff removal •    Gold returns to…

11 hours ago

Platinum Wave Analysis – 8 January 2026

Platinum: ⬇️ Sell - Platinum reversed from pivotal resistance level 150.00 - Likely to fall to…

1 day ago

Baidu Wave Analysis – 8 January 2026

Baidu: ⬇️ Sell - Baidu reversed from resistance zone - Likely to fall to support level…

1 day ago

EURUSD Wave Analysis – 8 January 2026

EURUSD: ⬇️ Sell - EURUSD broke daily up channel - Likely to fall to support…

1 day ago

WTI crude oil Wave Analysis – 8 January 2026

WTI crude oil: ⬆️ Buy - WTI crude oil reversed from support zone - Likely…

1 day ago

This website uses cookies