Categories: Technical analysis

S&P 500 Wave Analysis 22 July 2024

– S&P 500 continues daily uptrend

– Likely to rise to resistance level 5675.00

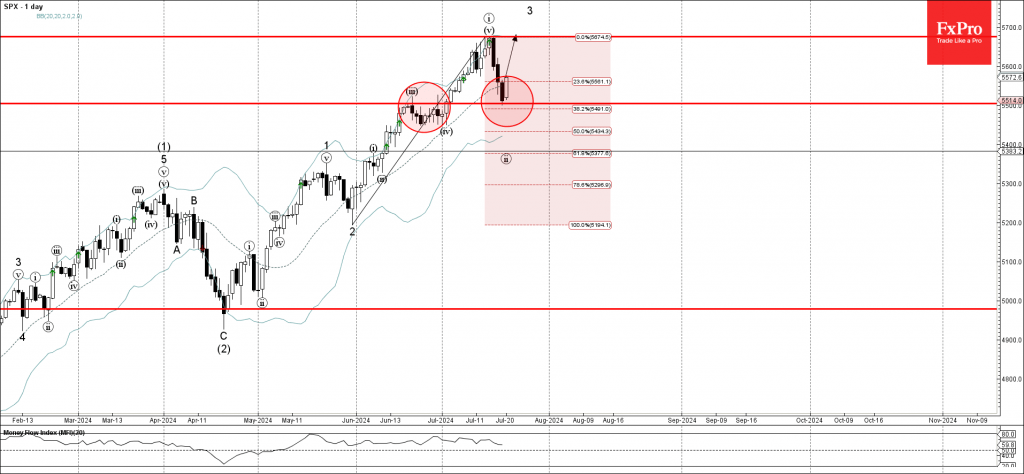
S&P 500 Index recently reversed from the support area between the key support level 5500.00 (former resistance from June) and the 38.2% Fibonacci correction of the previous upward impulse from May.

The upward reversal from this support area will likely form the daily Japanese candlesticks reversal pattern Bullish Engulfing if the price closes today near the current levels – a strong buy signal for this index.

Given the clear daily uptrend, S&P 500 Index can be expected to rise further to the next resistance level 5675.00 (top of the previous wave i).

The FxPro Tech Analysis Team

The FxPro technical experts prepare a daily analysis of the most active currency pairs (majors, crosses, exotics) and commodities. Selected instruments are reviewed on daily trends (D1, H4), using the active Elliott Wave setups, Japanese candlesticks, indicators, and support/resistance levels.

Share
Published by
The FxPro Tech Analysis Team
Tags: S&P 500

Recent Posts

Weak Chinese data paves the way for lower yuan

Saturday's statistics from China added to fears of a slowdown in the world's second-largest economy,…

5 hours ago

A new local peak in crypto?

Market Picture The crypto market started the weekend on a positive note but has been…

11 hours ago

Fed rate decision: intrigue returns

Influential financial media are promoting the need for a 50-basis point rate cut. The Fed's…

2 days ago

GBPCAD Wave Analysis 13 September 2024

GBPCAD reversed from strong resistance level 1.7850 Likely to fall to support level 1.7700 GBPCAD…

3 days ago

Ebay Wave Analysis 13 September 2024

- Ebay broke resistance level 62.00   - Likely to rise to the resistance level…

3 days ago

Gold broke through the ceiling

After three weeks of consolidation, gold moved decisively upwards, hitting a record above $2572 per…

3 days ago

This website uses cookies