Categories: Technical analysis

S&P 500 Wave Analysis – 18 October, 2022

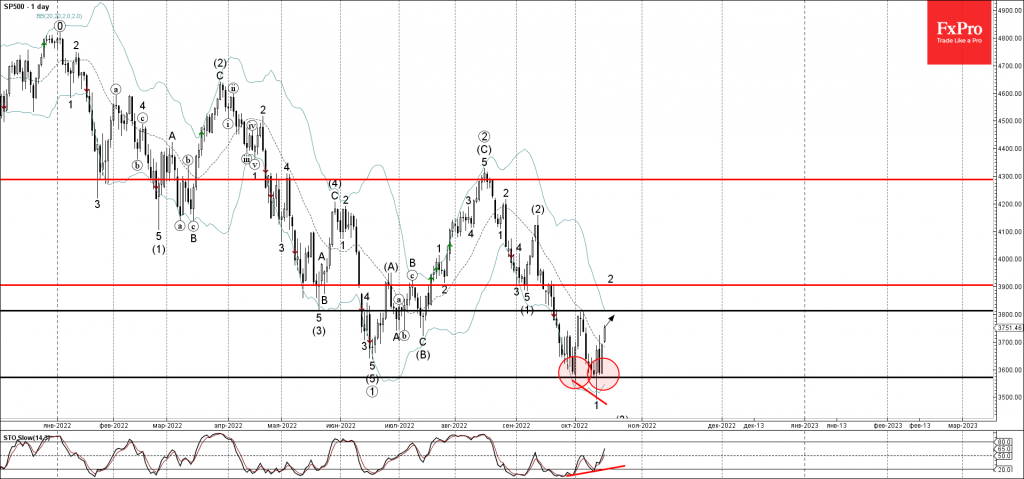
• S&P 500 reversed from key support level 3570.00

• Likely to rise to resistance level 3800.00

S&P 500 index recently reversed up with the daily Bullish Engulfing from the key support level 3570.00 (which stopped the price at the start of October) standing near the lower daily Bollinger Band.

The upward reversal from the support level 3570.00 started the active short-term corrective wave 2.

Given the improving risk sentiment globally and the clear divergence on the daily Stochastic indicator, S&P 500 index can be expected to rise toward the next resistance level 3800.00 (top of earlier daily Evening Star from the start of this month).

The FxPro Tech Analysis Team

The FxPro technical experts prepare a daily analysis of the most active currency pairs (majors, crosses, exotics) and commodities. Selected instruments are reviewed on daily trends (D1, H4), using the active Elliott Wave setups, Japanese candlesticks, indicators, and support/resistance levels.

Share
Published by
The FxPro Tech Analysis Team
Tags: S&P 500

Recent Posts

EURJPY Wave Analysis 2 May 2024

- EURJPY under strong bearish pressure - Likely to fall to support level 163.10 EURJPY…

11 hours ago

WTI crude oil Wave Analysis 2 May 2024

- WTI broke round support level 80.00 - Likely to fall to support level 76.00…

11 hours ago

ADP hints at another strong NFP on Friday

The monthly ADP labour market report showed that America created 192K new jobs in April, above…

2 days ago

Fed’s hawkish tone risks sinking S&P500 to 4700

Bears showed strength ahead of the FOMC decision.  U.S. indices sagged on Tuesday as investors…

2 days ago

A new stage of Bitcoin’s decline

Market Picture  Bitcoin's closing price on Tuesday became the lowest since late February, confirming the…

2 days ago

Ebay Wave Analysis 30 April 2024

- Ebay under the bearish pressure - Likely to fall to support level 51.00 Ebay…

2 days ago

This website uses cookies