Categories: Technical analysis

S&P 500 Wave Analysis – 18 July 2023


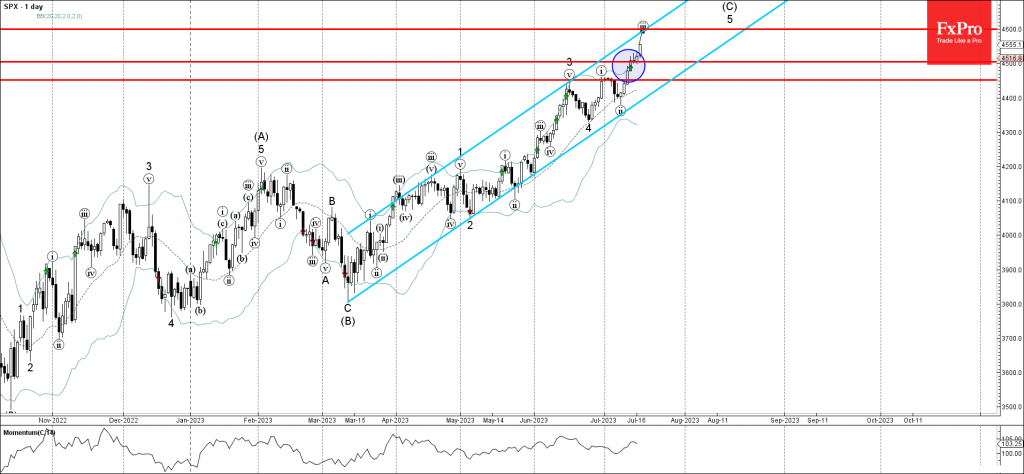
– S&P 500 broke resistance level 4500.00

– Likely to rise to resistance level 4600.00

S&P 500 index under the bullish pressure after the price broke above the key resistance level 4500.00.

The breakout of the resistance level 4500.00 accelerated the active impulse wave iii of the impulse wave 5 of the intermediate impulse sequence C from the start of March.

Given the prevailing uptrend, S&P 500 index can be expected to rise further toward the next resistance level 4600.00 (target price for the completion of the active impulse wave iii).

The FxPro Tech Analysis Team

The FxPro technical experts prepare a daily analysis of the most active currency pairs (majors, crosses, exotics) and commodities. Selected instruments are reviewed on daily trends (D1, H4), using the active Elliott Wave setups, Japanese candlesticks, indicators, and support/resistance levels.

Share
Published by
The FxPro Tech Analysis Team
Tags: spx

Recent Posts

Brent Crude oil Wave Analysis – 13 January 2026

Brent Crude oil ⬆️ Buy - Brent Crude oil rising inside impulse wave c -…

9 hours ago

USDJPY Wave Analysis – 13 January 2026

USDJPY ⬆️ Buy - USDJPY broke resistance area - Likely to rise to resistance level…

9 hours ago

Exxon Mobil Wave Analysis – 13 January 2026

Exxon Mobil ⬆️ Buy - Exxon Mobil broke resistance level 125.60 - Likely to rise…

9 hours ago

BNB Wave Analysis – 13 January 2026

Brent Crude oil ⬆️ Buy - BNB broke out of sideways price range - Likely…

9 hours ago

A slightly weaker CPI was not enough to break through the highs

US CPI data a bit softer than forecasts, sparking brief market optimism, but resistance remains.…

15 hours ago

Pro News Flash: Global Tensions Fuel a Fresh Oil Rally

🛢️ Oil prices are finding fresh strength as geopolitical tensions in the Middle East reignite…

15 hours ago

This website uses cookies