Categories: Technical analysis

S&P 500 Wave Analysis – 16 September, 2022

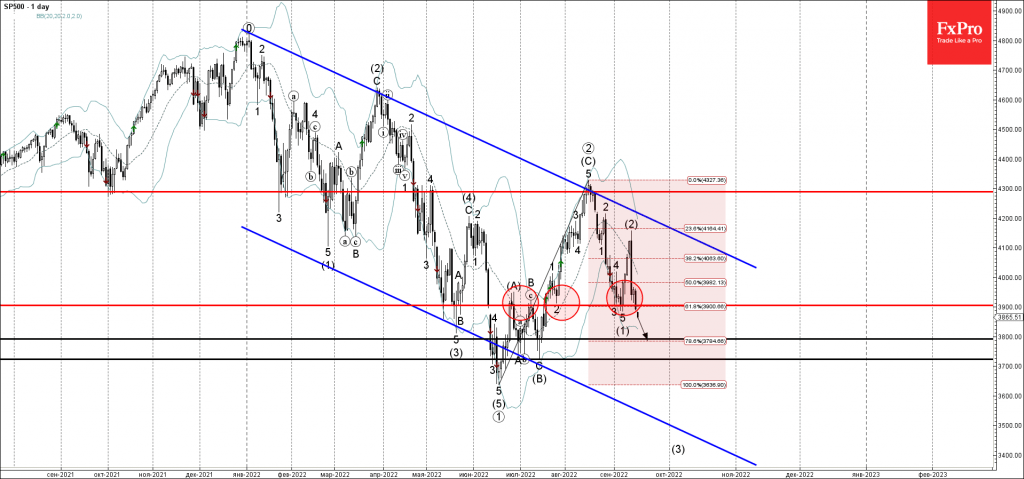
• S&P 500 broke key support level 3900.00

• Likely to fall to support level 3800.00

S&P 500 index recently broke the key support level 3900.00 (which has been reversing the price from the end of July) intersecting with the 61.8% Fibonacci correction of the upward ABC correction from June .

The breakout of the support level 3900.00 continues the active intermediate impulse wave (3), which is aligned with the clear downtrend from last December.

Given the expectation of further rate hikes in USA, S&P 500 index can be expected to fall toward the next support level 3800.00.

The FxPro Tech Analysis Team

The FxPro technical experts prepare a daily analysis of the most active currency pairs (majors, crosses, exotics) and commodities. Selected instruments are reviewed on daily trends (D1, H4), using the active Elliott Wave setups, Japanese candlesticks, indicators, and support/resistance levels.

Share
Published by
The FxPro Tech Analysis Team
Tags: sp500

Recent Posts

CHFJPY Wave Analysis – 9 January 2026

CHFJPY: ⬆️ Buy - CHFJPY reversed from support area - Likely to rise to resistance…

1 day ago

Exxon Mobil Wave Analysis – 9 January 2026

Exxon Mobil: ⬆️ Buy - Exxon Mobil reversed from support area - Likely to rise…

1 day ago

Pro News Weekly: Dollar Rebounds as Markets Test New Limits

Welcome to Pro News Weekly! Here’s what is shaping the markets: 💵 The U.S. dollar…

1 day ago

Geopolitics will destroy the euro

•    EURUSD falls due to geopolitics and expectations of tariff removal •    Gold returns to…

2 days ago

Platinum Wave Analysis – 8 January 2026

Platinum: ⬇️ Sell - Platinum reversed from pivotal resistance level 150.00 - Likely to fall to…

2 days ago

Baidu Wave Analysis – 8 January 2026

Baidu: ⬇️ Sell - Baidu reversed from resistance zone - Likely to fall to support level…

2 days ago

This website uses cookies