Categories: Technical analysis

S&P 500 Wave Analysis 15 February 2024

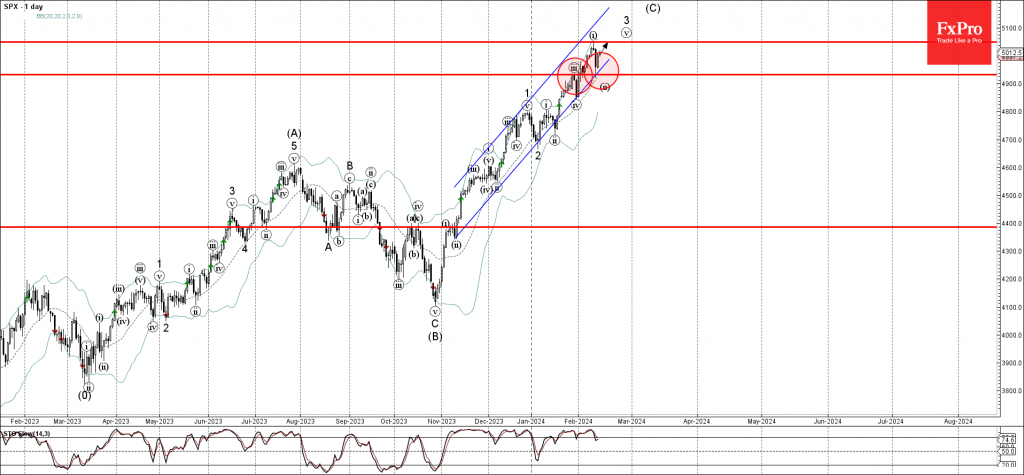
– S&P 500 reversed from support level 4930.00

– Likely to rise to resistance level 5050.00

S&P 500 index recently reversed up from the support level 4930.00 (former support from the end of January), intersecting with the 20-day moving average and the support trendline of the daily up channel from November.

The upward reversal from the support level 1.3530 stopped the previous minor correction (ii).

Given the clear daily uptrend, S&P 500 index can be expected to rise further to the next resistance level 5050.00.

The FxPro Tech Analysis Team

The FxPro technical experts prepare a daily analysis of the most active currency pairs (majors, crosses, exotics) and commodities. Selected instruments are reviewed on daily trends (D1, H4), using the active Elliott Wave setups, Japanese candlesticks, indicators, and support/resistance levels.

Share
Published by
The FxPro Tech Analysis Team
Tags: S&P 500

Recent Posts

Apple Wave Analysis 17 October 2024

- Apple reversed from key resistance level 237.00 - Likely to fall to support level 227.00…

12 hours ago

Aig Wave Analysis 17 October 2024

- Aig reversed from support level 76.60 - Likely to rise to resistance level 79.65 Aig recently…

12 hours ago

The Crypto Market Stabilises at the Top

Market Picture The cryptocurrency market remains steady at around $2.31 trillion in market capitalisation, mirroring…

21 hours ago

GBPCAD Wave Analysis 16 October 2024

- GBPCAD reversed from resistance zone - Likely to fall to support level 1.7750 GBPCAD…

1 day ago

USDCHF Wave Analysis 16 October 2024

- USDCHF broke resistance zone - Likely to rise to resistance level 0.8730 USDCHF currency…

1 day ago

Pound Suppressed by Weak Inflation

The British pound fell below the 1.30 level against the dollar after weak inflation data…

2 days ago

This website uses cookies