Categories: Technical analysis

S&P 500 Wave Analysis – 13 February 2025

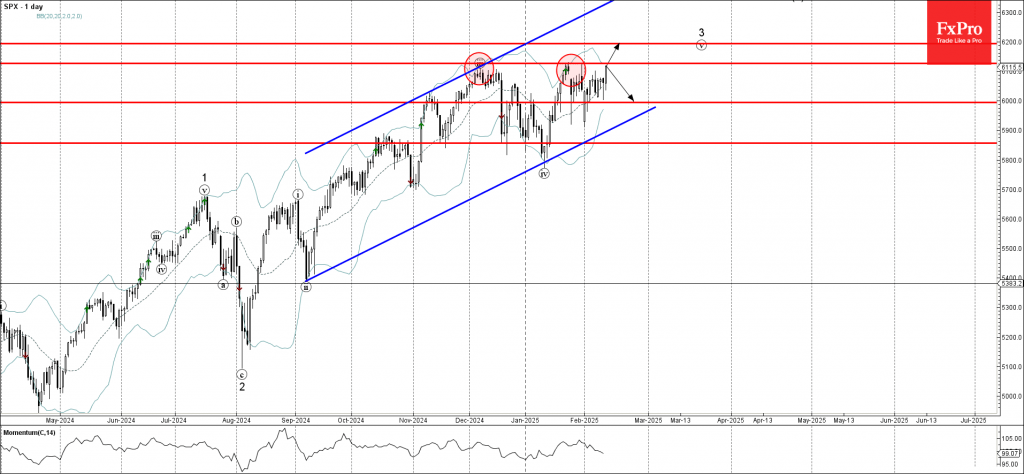
– S&P 500 approaching key resistance level 6125.00

– Likely to rise to resistance level 6200.00

S&P 500 index recently rose sharply and is currently approaching the key resistance level 6125.00, which has been reversing the index from December.

The subsequent price movement will depend on whether the index can break above the resistance level 6125.00 .

If the S&P 500 index breaks above 6125.00, the price can then rise to the next resistance level 6200.00 (target price for the completion of the active impulse wave 3). In the opposite scenario, the price is likely to correct down to the next round support level 6000.00.

The FxPro Tech Analysis Team

The FxPro technical experts prepare a daily analysis of the most active currency pairs (majors, crosses, exotics) and commodities. Selected instruments are reviewed on daily trends (D1, H4), using the active Elliott Wave setups, Japanese candlesticks, indicators, and support/resistance levels.

Share
Published by
The FxPro Tech Analysis Team
Tags: SPX500

Recent Posts

Geopolitics will destroy the euro

•    EURUSD falls due to geopolitics and expectations of tariff removal •    Gold returns to…

8 hours ago

Platinum Wave Analysis – 8 January 2026

Platinum: ⬇️ Sell - Platinum reversed from pivotal resistance level 150.00 - Likely to fall to…

21 hours ago

Baidu Wave Analysis – 8 January 2026

Baidu: ⬇️ Sell - Baidu reversed from resistance zone - Likely to fall to support level…

21 hours ago

EURUSD Wave Analysis – 8 January 2026

EURUSD: ⬇️ Sell - EURUSD broke daily up channel - Likely to fall to support…

22 hours ago

WTI crude oil Wave Analysis – 8 January 2026

WTI crude oil: ⬆️ Buy - WTI crude oil reversed from support zone - Likely…

22 hours ago

Do not underestimate dollar

Positive macro statistics for the US are helping the greenback. Gold could rise to $4,610…

1 day ago

This website uses cookies