Categories: Technical analysis

S&P 500 Wave Analysis – 13 August 2025

S&P 500: ⬆️ Buy

– S&P 500 broke key resistance level 6435.00

– Likely to rise to resistance level 6600.00

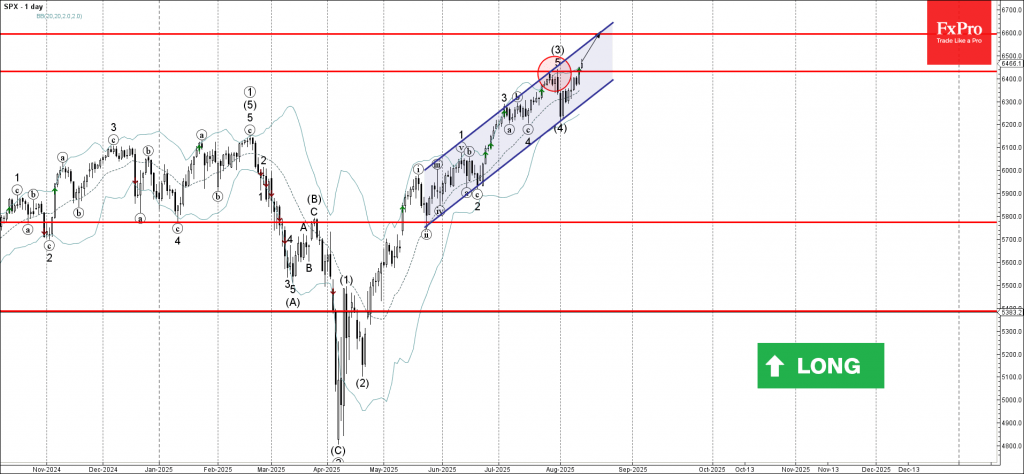
S&P 500 index recently broke above the key resistance level 6435.00, which stopped the previous intermediate impulse wave (3) in July.

The breakout of the resistance level 6435.00 continues the active intermediate impulse wave (5) from the start of August.

Given the overriding daily uptrend, S&P 500 index can be expected to rise to the next resistance level 6600.00, coinciding with the daily up channel from May.

The FxPro Tech Analysis Team

The FxPro technical experts prepare a daily analysis of the most active currency pairs (majors, crosses, exotics) and commodities. Selected instruments are reviewed on daily trends (D1, H4), using the active Elliott Wave setups, Japanese candlesticks, indicators, and support/resistance levels.

Share
Published by
The FxPro Tech Analysis Team
Tags: S&P 500

Recent Posts

Geopolitics will destroy the euro

•    EURUSD falls due to geopolitics and expectations of tariff removal •    Gold returns to…

16 minutes ago

Platinum Wave Analysis – 8 January 2026

Platinum: ⬇️ Sell - Platinum reversed from pivotal resistance level 150.00 - Likely to fall to…

13 hours ago

Baidu Wave Analysis – 8 January 2026

Baidu: ⬇️ Sell - Baidu reversed from resistance zone - Likely to fall to support level…

13 hours ago

EURUSD Wave Analysis – 8 January 2026

EURUSD: ⬇️ Sell - EURUSD broke daily up channel - Likely to fall to support…

15 hours ago

WTI crude oil Wave Analysis – 8 January 2026

WTI crude oil: ⬆️ Buy - WTI crude oil reversed from support zone - Likely…

15 hours ago

Do not underestimate dollar

Positive macro statistics for the US are helping the greenback. Gold could rise to $4,610…

22 hours ago

This website uses cookies