Categories: Technical analysis

S&P 500 Wave Analysis – 13 June 2023

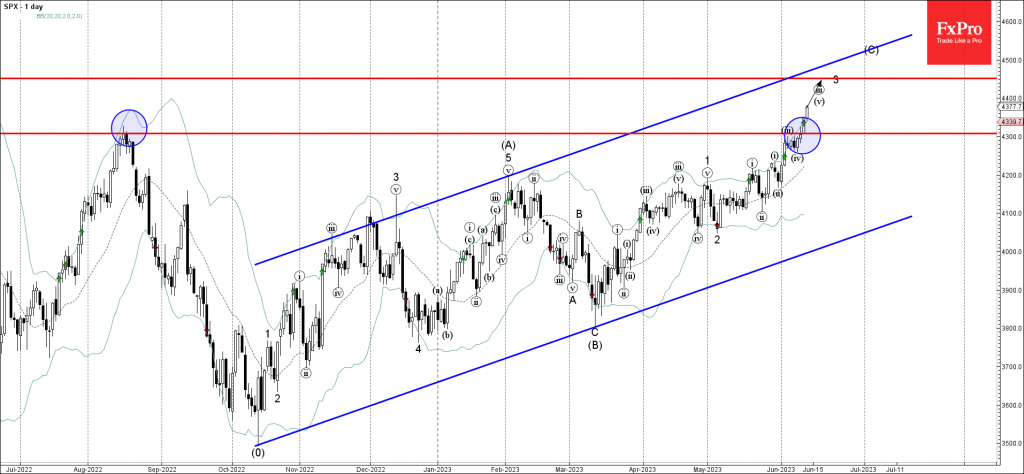
– S&P 500 broke key resistance level 4310.00

– Likely to rise to resistance level 4450.00

S&P 500 index recently broke sharply above the key resistance level 4310.00 (former multi-month high from August).

The breakout of the resistance level 4310.00 accelerated the active minor impulse wave 3 of the intermediate impulse wave (C) from the start of March.

Given the strong multi-month uptrend, S&P 500 index can be expected to rise further toward the next resistance level 4450.00 (target for the completion of the active impulse wave 3).

AddThis Website Tools
The FxPro Tech Analysis Team

The FxPro technical experts prepare a daily analysis of the most active currency pairs (majors, crosses, exotics) and commodities. Selected instruments are reviewed on daily trends (D1, H4), using the active Elliott Wave setups, Japanese candlesticks, indicators, and support/resistance levels.

Share
Published by
The FxPro Tech Analysis Team
Tags: SPX500

Recent Posts

Tariff news and resistance zone put pressure on crypto

The crypto market capitalisation decreased by 2.6% in 24 hours due to the announcement of…

59 minutes ago

Gold Wave Analysis – 16 April 2025

Gold: ⬆️ Buy - Gold broke resistance zone - Likely to rise to the resistance…

5 hours ago

GBPUSD Wave Analysis – 16 April 2025

GBPUSD: ⬆️ Buy - GBPUSD broke key resistance level 1.3200 - Likely to rise to…

5 hours ago

Platinum Wave Analysis – 15 April 2025

Platinum: ⬆️ Buy - Platinum reversed from support level 905.00 - Likely to rise to…

15 hours ago

USDJPY Wave Analysis – 15 April 2025

USDJPY: ⬆️ Buy - USDJPY reversed from long-term support level 142.00 - Likely to rise…

15 hours ago

FTSE 100 Wave Analysis – 15 April 2025

FTSE 100: ⬆️ Buy - FTSE 100 index broke the resistance zone - Likely to rise…

17 hours ago