Categories: Technical analysis

S&P 500 index Wave Analysis 28 July 2023

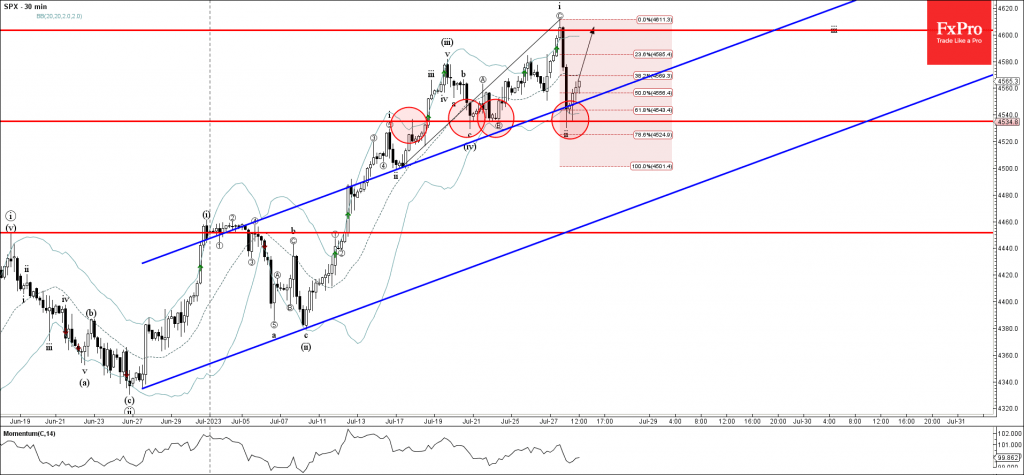
– S&P 500 index reversed from support level 4535.00

– Likely to rise to resistance level 4600.00

S&P 500 index recently reversed up from the key support level 4535.00 (which has reversed the price multiples time earlier this month as can be seen below).

The support level 4535.00 was strengthened by the lower daily Bollinger Band, 61.8% Fibonacci correction of the upward impulse from the middle of July and the upper trendline of the daily up channel from June.

Given the clear daily uptrend, S&P 500 index can be expected to rise further toward the next resistance level 4600.00 (which stopped the previous impulse wave i).

The FxPro Tech Analysis Team

The FxPro technical experts prepare a daily analysis of the most active currency pairs (majors, crosses, exotics) and commodities. Selected instruments are reviewed on daily trends (D1, H4), using the active Elliott Wave setups, Japanese candlesticks, indicators, and support/resistance levels.

Share
Published by
The FxPro Tech Analysis Team
Tags: spx

Recent Posts

EURCAD Wave Analysis 6 September 2024

- EURCAD reversed from pivotal support level 1.4900 - Likely to rise to resistance level…

1 day ago

EURUSD Wave Analysis 6 September 2024

- EURUSD reversed from support level 1.1030 - Likely to rise to resistance level 1.1200…

1 day ago

Further Unwinding of Carry Trade

The unwinding of the carry trade in the FX market continues, with the major safe…

1 day ago

Bitcoin pressured by risk-off mood

Market Picture The pressure on risk assets continues, pushing the crypto market capitalisation back below…

2 days ago

AUDUSD Wave Analysis 5 September 2024

- AUDUSD reversed from support level 0.6700 - Likely to rise to resistance level 0.6800…

2 days ago

Gold Wave Analysis 5 September 2024

- Gold reversed from support level 2475.00 - Likely to rise to resistance level 2535.00…

2 days ago

This website uses cookies