Categories: Technical analysis

S&P 500 index Wave Analysis – 27 June 2023

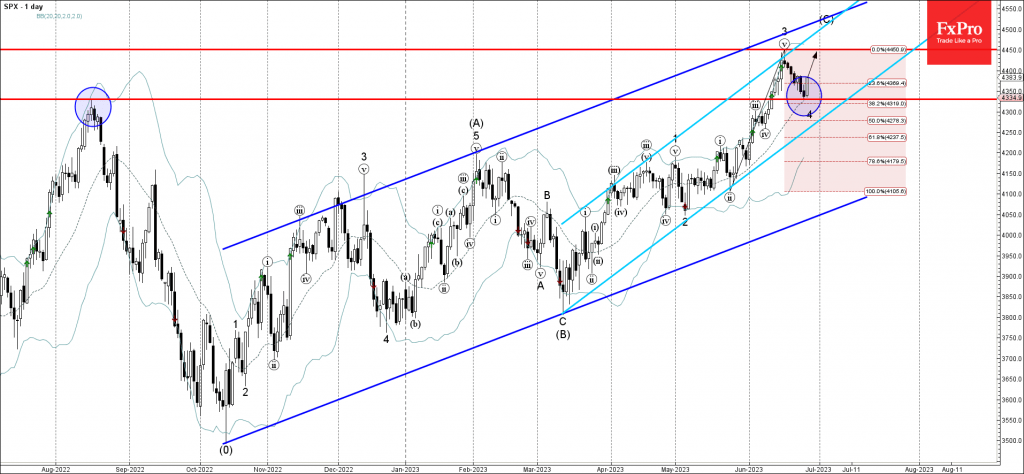
– S&P 500 reversed from support level 4330.0

– Likely to rise to resistance level 4450.00

S&P 500 index recently reversed up from the key support level 4330.0 (former multi-month high from August of 2022, acting as the support after it was broken at the start of June) standing near the 38.2% Fibonacci correction of the upward impose from May.

The upward reversal from the support level 4330.00 stopped the previous short-term corrective wave 4.

Given the prevailing uptrend, S&P 500 index can be expected to rise further toward the next resistance level 4450.00 (top of the previous impulse wave 3).

The FxPro Tech Analysis Team

The FxPro technical experts prepare a daily analysis of the most active currency pairs (majors, crosses, exotics) and commodities. Selected instruments are reviewed on daily trends (D1, H4), using the active Elliott Wave setups, Japanese candlesticks, indicators, and support/resistance levels.

Share
Published by
The FxPro Tech Analysis Team
Tags: S&P 500

Recent Posts

Gold Wave Analysis – 12 December 2025

Gold: ⬇️ Sell - Gold reversed from strong resistance level 4350.00 - Likely to fall to…

2 days ago

EURGBP Wave Analysis – 12 December 2025

EURGBP: ⬆️ Buy - EURGBP reversed from support zone - Likely to rise to resistance level…

2 days ago

Filecoin Wave Analysis – 12 December 2025

Filecoin: ⬇️ Sell - Filecoin broke key support level 1.435 - Likely to fall to support…

2 days ago

Ethereum Wave Analysis – 12 December 2025

Ethereum: ⬇️ Sell - Ethereum reversed from resistance level 3400.00 - Likely to fall to support…

2 days ago

Pro News Weekly: Global Markets at a Turning Point

Welcome to Pro News Weekly! Here’s what is moving the markets: 💵 The Fed fails…

3 days ago

Crypto: slight rebound within a bear market

Crypto rebounds slightly in a bear market; resistance holds, optimism rises, but the outlook remains…

3 days ago

This website uses cookies