Categories: Technical analysis

S&P 500 Index Wave Analysis 2 August 2024

– S&P 500 Index under bearish pressure

– Likely to fall to support level 5200.00

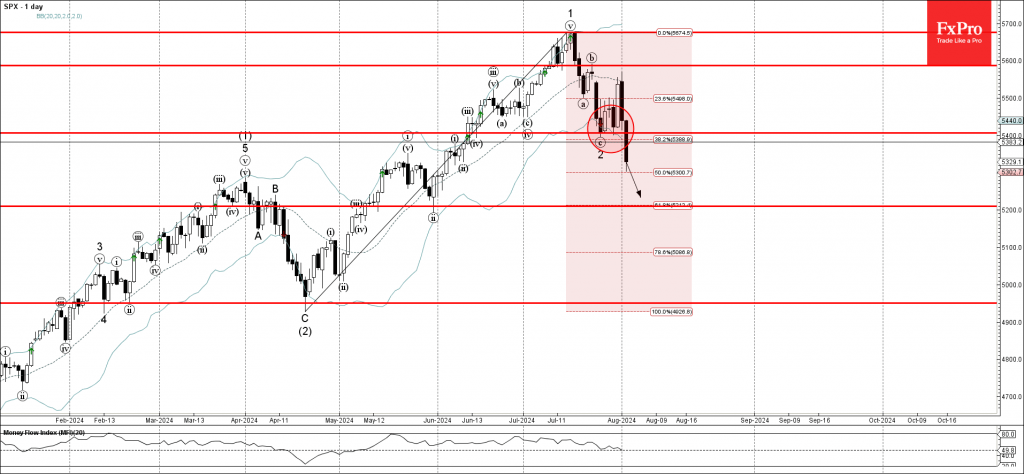
S&P 500 Index is under the bearish pressure after the price broke below the key support level 5400.00, which reversed the price with two consecutive Bullish Engulfing reversal patterns at the end of July.

The breakout of the support level 5400.00 coincided with the breakout of the 38.2% Fibonacci correction of the upward impulse 1 from April.

Given the prevailing pessimism that can be seen across the equity markets today, S&P 500 Index can be expected to fall further toward the next support level 5200.00 (low of wave ii from the end of May).

The FxPro Tech Analysis Team

The FxPro technical experts prepare a daily analysis of the most active currency pairs (majors, crosses, exotics) and commodities. Selected instruments are reviewed on daily trends (D1, H4), using the active Elliott Wave setups, Japanese candlesticks, indicators, and support/resistance levels.

Share
Published by
The FxPro Tech Analysis Team
Tags: S&P 500

Recent Posts

AUDCAD Wave Analysis 18 September 2024

- AUDCAD broke pivotal resistance level 0.9170 - Likely to rise to resistance level 0.9260…

6 hours ago

WTI Wave Analysis 18 September 2024

- WTI reversed from round resistance level 70.00 - Likely to fall to support level…

6 hours ago

Strong data didn’t derail markets from expectations of a 50bp Fed cut

US retail sales rose 0.1% m/m in August, better than forecast, but sales growth in…

14 hours ago

The crypto market gets a boost from stocks

Market Picture The crypto market has gained 2.1% in the last 24 hours to reach…

17 hours ago

MasterCard Wave Analysis 17 September 2024

- MasterCard broke round resistance level 500.00 - Likely to rise to the resistance level…

1 day ago

CHFJPY Wave Analysis 17 September 2024

- CHFJPY reversed from support zone - Likely to rise to the resistance level 168.45…

1 day ago

This website uses cookies