Categories: Technical analysis

S&P 500 index Wave Analysis 19 November 2024

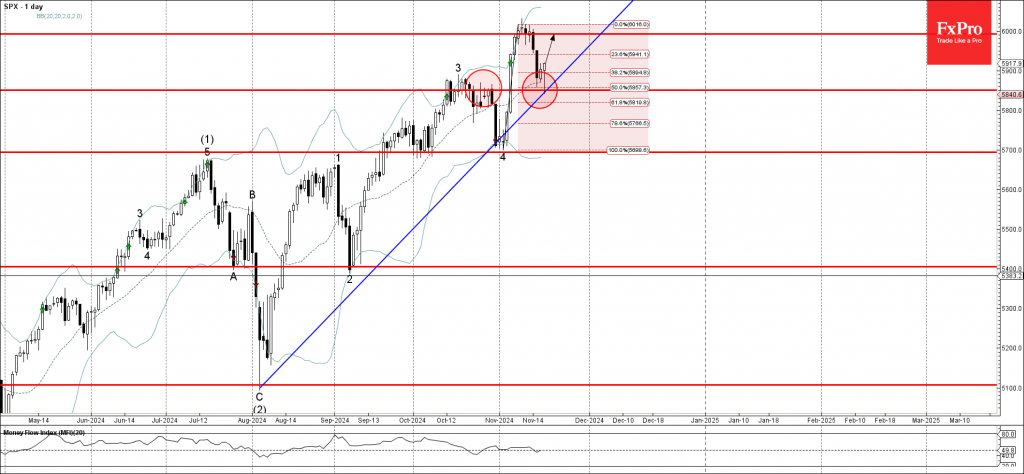
– S&P 500 index reversed from support zone

– Likely to rise to resistance level 6000.00

S&P 500 index recently reversed up from the pivotal support level 5850.00 (former multi-day resistance from October).

The support level 5850.00 was further strengthened by the lower daily Bollinger Band, support trendline from August and the 50% Fibonacci correction of the upward impulse from the start of November.

Given the clear daily uptrend, S&P 500 index can be expected to rise to the next round resistance level 6000.00.

The FxPro Tech Analysis Team

The FxPro technical experts prepare a daily analysis of the most active currency pairs (majors, crosses, exotics) and commodities. Selected instruments are reviewed on daily trends (D1, H4), using the active Elliott Wave setups, Japanese candlesticks, indicators, and support/resistance levels.

Share
Published by
The FxPro Tech Analysis Team
Tags: S&P 500

Recent Posts

ECB, BoE, and BoJ take different paths

Trump pushes for more Fed rate cuts, while no changes are expected from the ECB…

3 hours ago

Crypto Market Holds at $3T Amid Broken Uptrend

Crypto market stays near $3T amid correction, ETF inflows rise, sentiment weakens, and volatility expected…

4 hours ago

Gold Wave Analysis – 12 December 2025

Gold: ⬇️ Sell - Gold reversed from strong resistance level 4350.00 - Likely to fall to…

3 days ago

EURGBP Wave Analysis – 12 December 2025

EURGBP: ⬆️ Buy - EURGBP reversed from support zone - Likely to rise to resistance level…

3 days ago

Filecoin Wave Analysis – 12 December 2025

Filecoin: ⬇️ Sell - Filecoin broke key support level 1.435 - Likely to fall to support…

3 days ago

Ethereum Wave Analysis – 12 December 2025

Ethereum: ⬇️ Sell - Ethereum reversed from resistance level 3400.00 - Likely to fall to support…

3 days ago

This website uses cookies