Categories: Technical analysis

S&P 500 index Wave Analysis 10 November 2023

– S&P 500 broke key resistance level 4385.00

– Likely to rise to resistance level 4450.00.


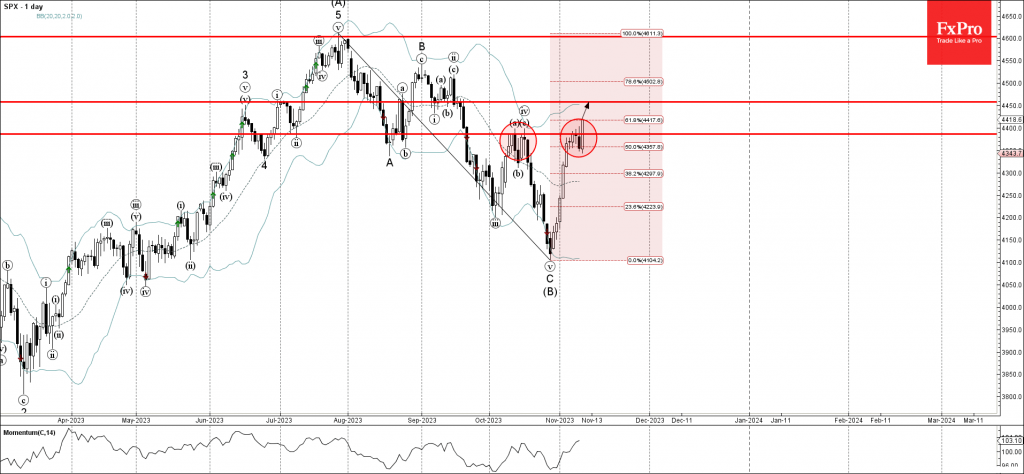
S&P 500 index recently broke the key resistance level 4385.00 (previous double top from October) standing near the 50% Fibonacci correction of the downward ABC correction 2 from July.

The breakout of the resistance level 4385.00 accelerated the active medium-term impulse wave (3).

Given the prevalence of the risk-on sentiment seen today, S&P 500 index can be expected to rise further toward the next resistance level 4450.00.

The FxPro Tech Analysis Team

The FxPro technical experts prepare a daily analysis of the most active currency pairs (majors, crosses, exotics) and commodities. Selected instruments are reviewed on daily trends (D1, H4), using the active Elliott Wave setups, Japanese candlesticks, indicators, and support/resistance levels.

Share
Published by
The FxPro Tech Analysis Team
Tags: S&P 500

Recent Posts

Weak Chinese data paves the way for lower yuan

Saturday's statistics from China added to fears of a slowdown in the world's second-largest economy,…

6 hours ago

A new local peak in crypto?

Market Picture The crypto market started the weekend on a positive note but has been…

12 hours ago

Fed rate decision: intrigue returns

Influential financial media are promoting the need for a 50-basis point rate cut. The Fed's…

2 days ago

GBPCAD Wave Analysis 13 September 2024

GBPCAD reversed from strong resistance level 1.7850 Likely to fall to support level 1.7700 GBPCAD…

3 days ago

Ebay Wave Analysis 13 September 2024

- Ebay broke resistance level 62.00   - Likely to rise to the resistance level…

3 days ago

Gold broke through the ceiling

After three weeks of consolidation, gold moved decisively upwards, hitting a record above $2572 per…

3 days ago

This website uses cookies