Categories: Technical analysis

Soy Wave Analysis 30 November, 2020

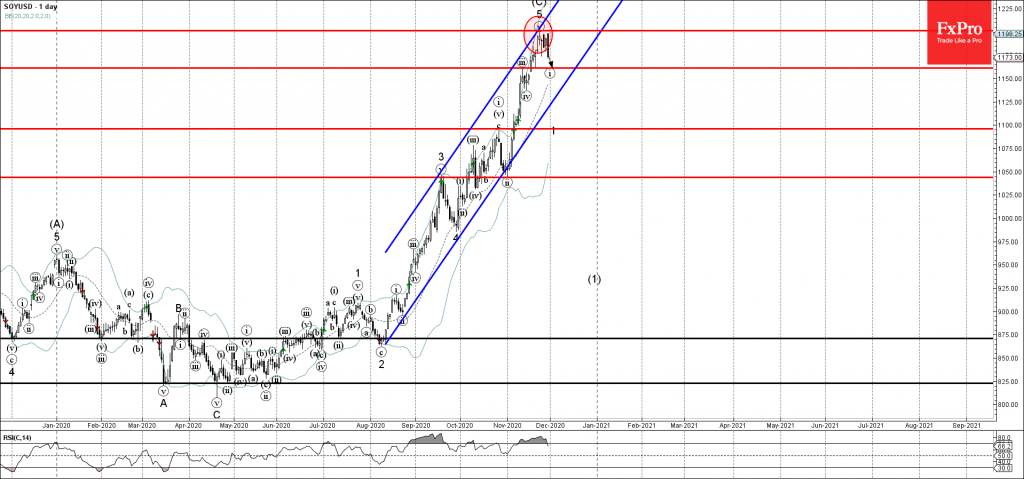
• Soy reversed from long-term resistance level 1200.00

• Likely to correct down to 1200.00

Soy recently reversed down from the key resistance level 1200.00 (former multi-year high from the middle of 2016) intersecting with the upper daily and weekly Bollinger Bands.

The downward reversal from the resistance level 1200.00 started the active short-term downward impulse wave (i).

Given the strength of the resistance level 1200.00 and the overbought daily RSI – Soy is expected to fall further toward the next support level 1160.00 (target price for the completion of the active impulse wave (i)).

The FxPro Tech Analysis Team

The FxPro technical experts prepare a daily analysis of the most active currency pairs (majors, crosses, exotics) and commodities. Selected instruments are reviewed on daily trends (D1, H4), using the active Elliott Wave setups, Japanese candlesticks, indicators, and support/resistance levels.

Share
Published by
The FxPro Tech Analysis Team
Tags: SOYUSD

Recent Posts

Bitcoin Cash Wave Analysis – 12 January 2026

Bitcoin Cash: ⬇️ Sell - Bitcoin Cash reversed from resistance area - Likely to fall…

21 minutes ago

EURJPY Wave Analysis – 12 January 2026

EURJPY: ⬆️ Buy - EURJPY reversed from support area - Likely to rise to resistance…

23 minutes ago

Gold shines on an anti-fiat thesis

The dollar suffered due to threats to the Fed’s independence. Gold managed to renew its…

10 hours ago

SP500 Current situation #trading #tradelikeapro #sp500 #tradingshorts #tradingstrategy

Today is Monday, the 12th of January, and once again we will talk about the…

11 hours ago

Crypto: sell-the-growth continues

Crypto markets remain volatile; Bitcoin faces selling pressure, XRP slips, Monero surges, and market signals…

12 hours ago

CHFJPY Wave Analysis – 9 January 2026

CHFJPY: ⬆️ Buy - CHFJPY reversed from support area - Likely to rise to resistance…

3 days ago

This website uses cookies