Categories: Technical analysis

Soy Wave Analysis – 24 December , 2018

  • Soy broke daily up channel
  • Further losses are likely

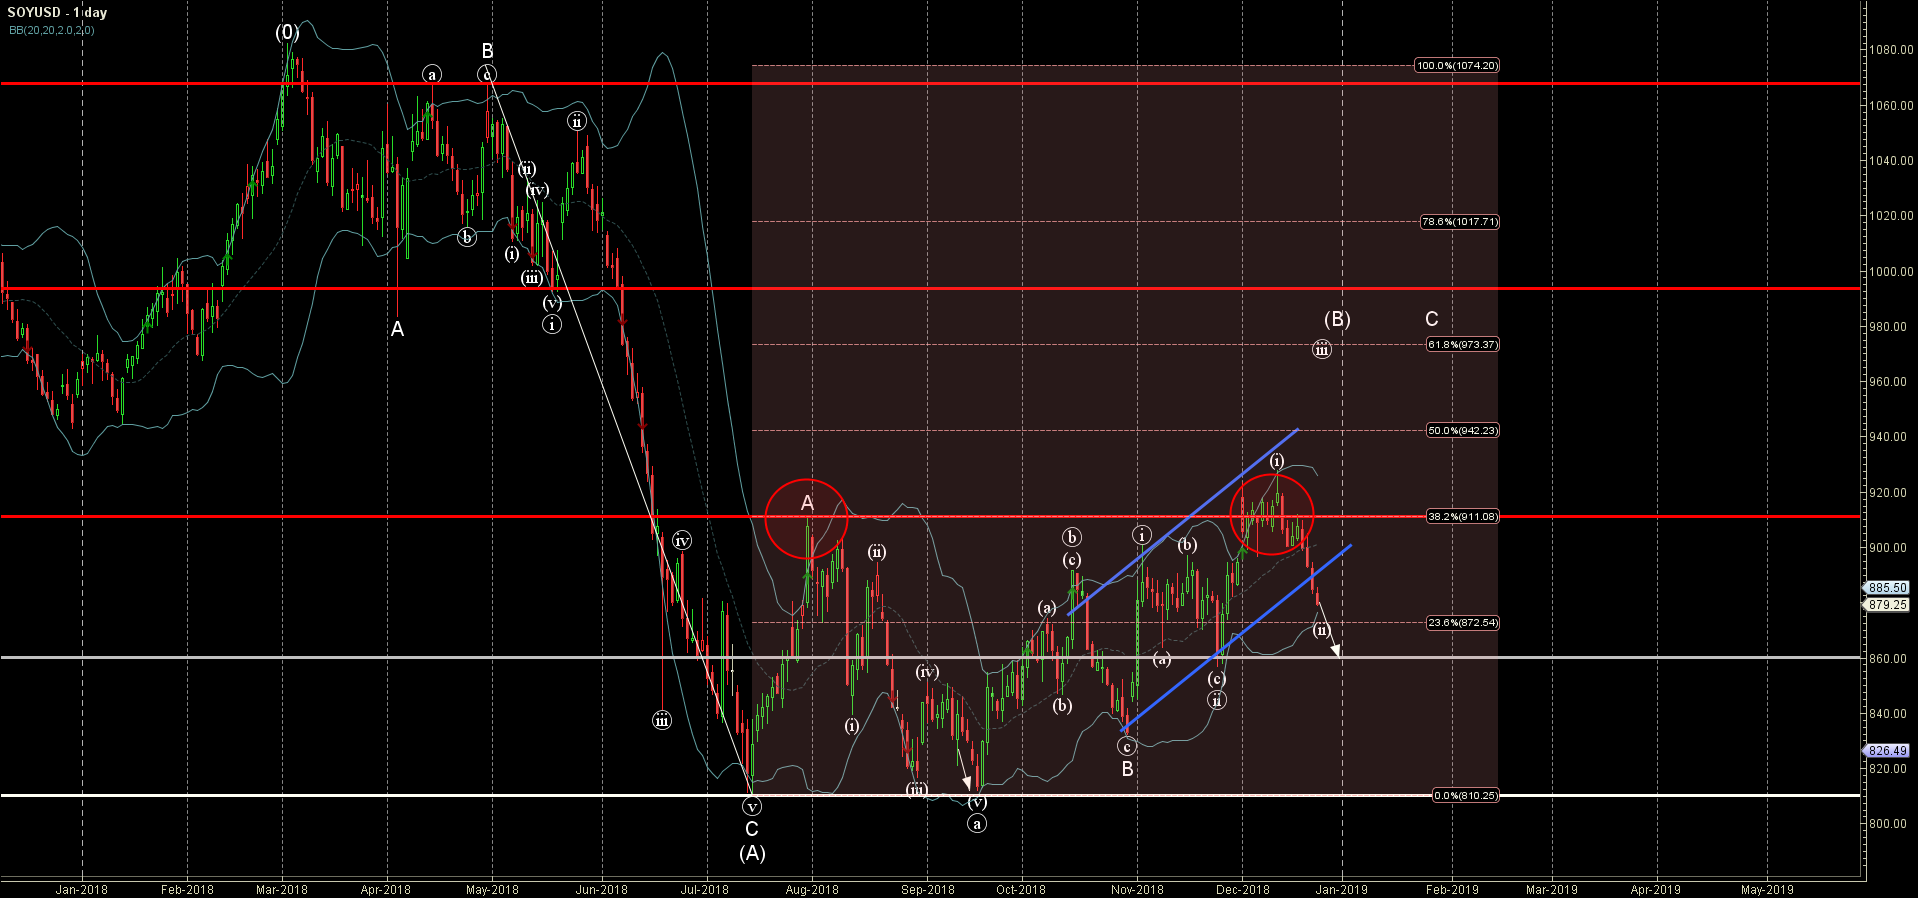
FxPro analyst said that Soy continues to fall inside the short-term corrective wave (ii), which started earlier from the resistance zone lying between the key resistance level 910.00 (monthly high from July), upper daily Bollinger Band and the 38.2% Fibonacci correction of the previous sharp downward impulse from April.

Soy yesterday broke the support trendline of the daily up channel from the end of October – which strengthened the pressure on this instrument.

Soy is expected to fall further and re-test the next support level 860.00 (low of the previous short-term corrections (a) and (c)).

The FxPro Tech Analysis Team

The FxPro technical experts prepare a daily analysis of the most active currency pairs (majors, crosses, exotics) and commodities. Selected instruments are reviewed on daily trends (D1, H4), using the active Elliott Wave setups, Japanese candlesticks, indicators, and support/resistance levels.

Share
Published by
The FxPro Tech Analysis Team
Tags: SOYUSD

Recent Posts

Crypto Market Retreats Due to Overhang of Sellers

Market picture The crypto market has lost 3.3% in the last 24 hours to $2.3…

2 hours ago

USDJPY Wave Analysis 26 April 2024

- USDJPY broke key resistance level 155.00 - Likely to rise to resistance level 160.00…

3 days ago

Ebay Wave Analysis 26 April 2024

- Ebay reversed from support level 49.35 - Likely to rise to resistance level 52.55…

3 days ago

False Alert with Yen Interventions?

Even though the Bank of Japan left the key rate and parameters of the QE…

3 days ago

Cooler Bitcoin

Market picture  Market Dynamics: The cryptocurrency market stabilised, losing just 0.1% of capitalisation and dropping to…

3 days ago

GBPCAD Wave Analysis 25 April 2024

- GBPCAD reversed from key support level 1.6910 - Likely to rise to resistance level…

4 days ago

This website uses cookies