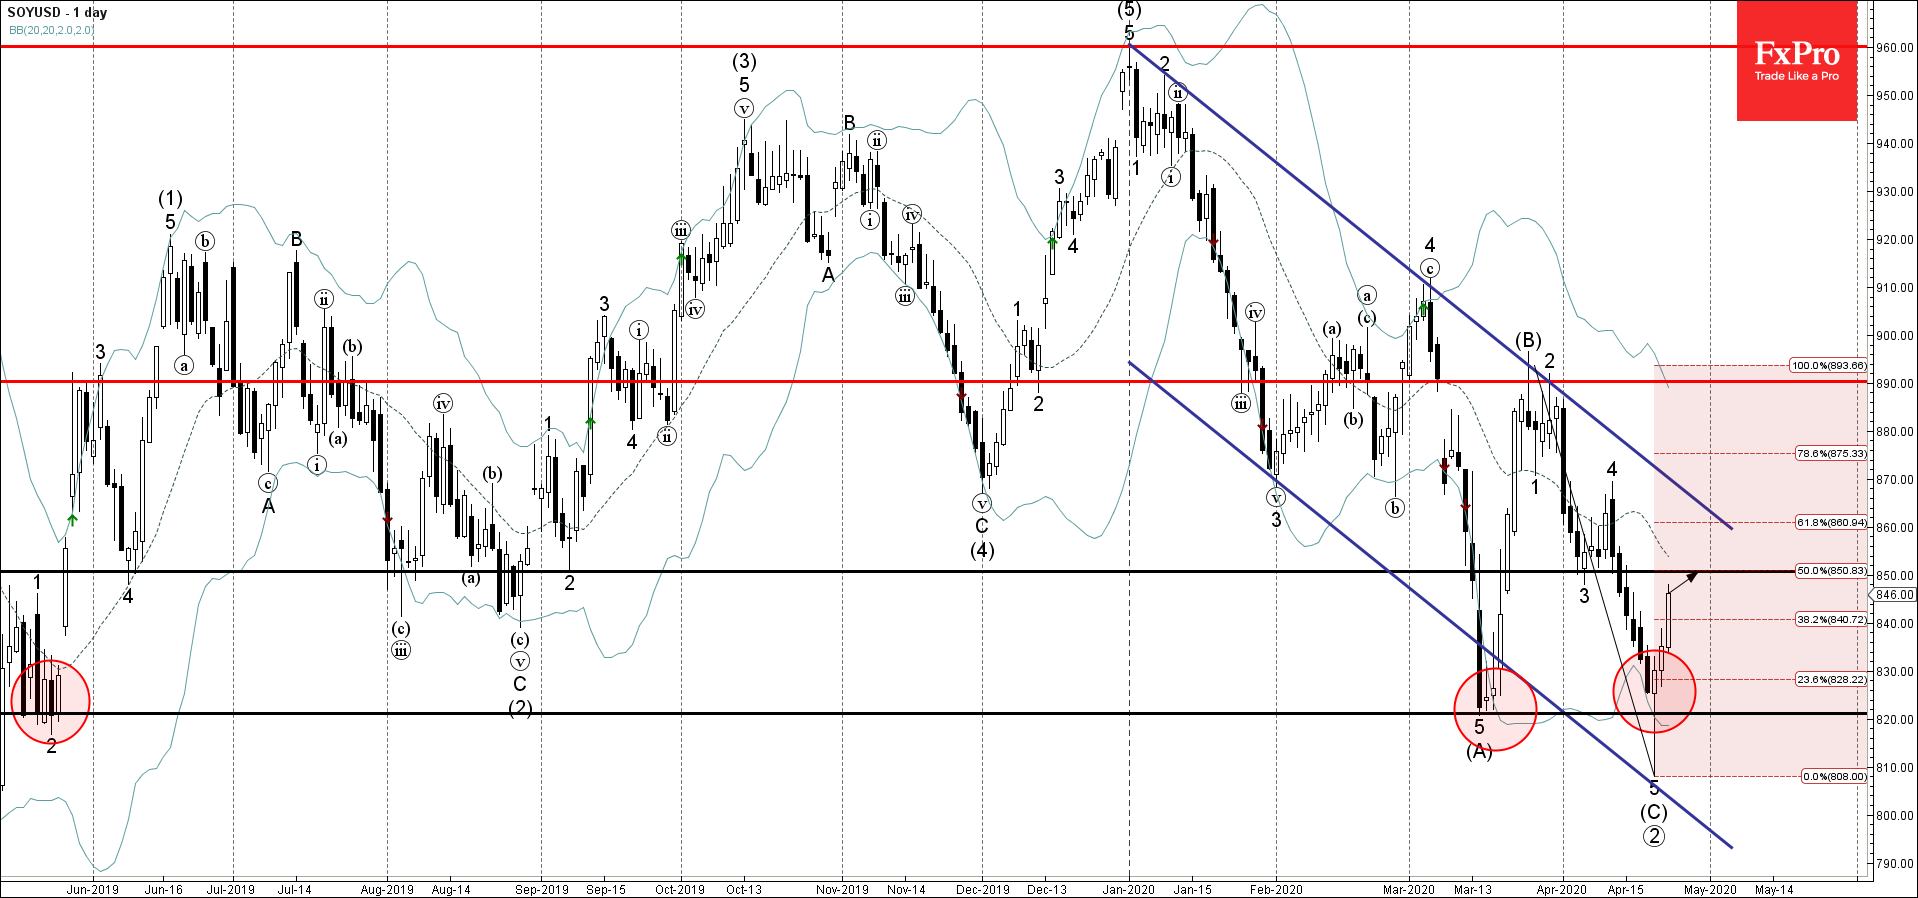
- Soy reversed from support area
- Likely to rise to 850.00
Soy reverently reversed up sharply from the support area lying between the long-term support level 820.0 (which has been reversing the price from 2019), lower daily Bollinger Band and the support trendline of the daily down channel from January.
The upward reversal from this support area created the daily candlestick reversal pattern Hammer – which stopped the previous sharp impulse wave (C).
Soy is expected to rise further toward the next resistance level 850.00 (former support from the start of April., which stopped the earlier impulse wave 3).