Categories: Technical analysis

Soy Wave Analysis – 12 November, 2019

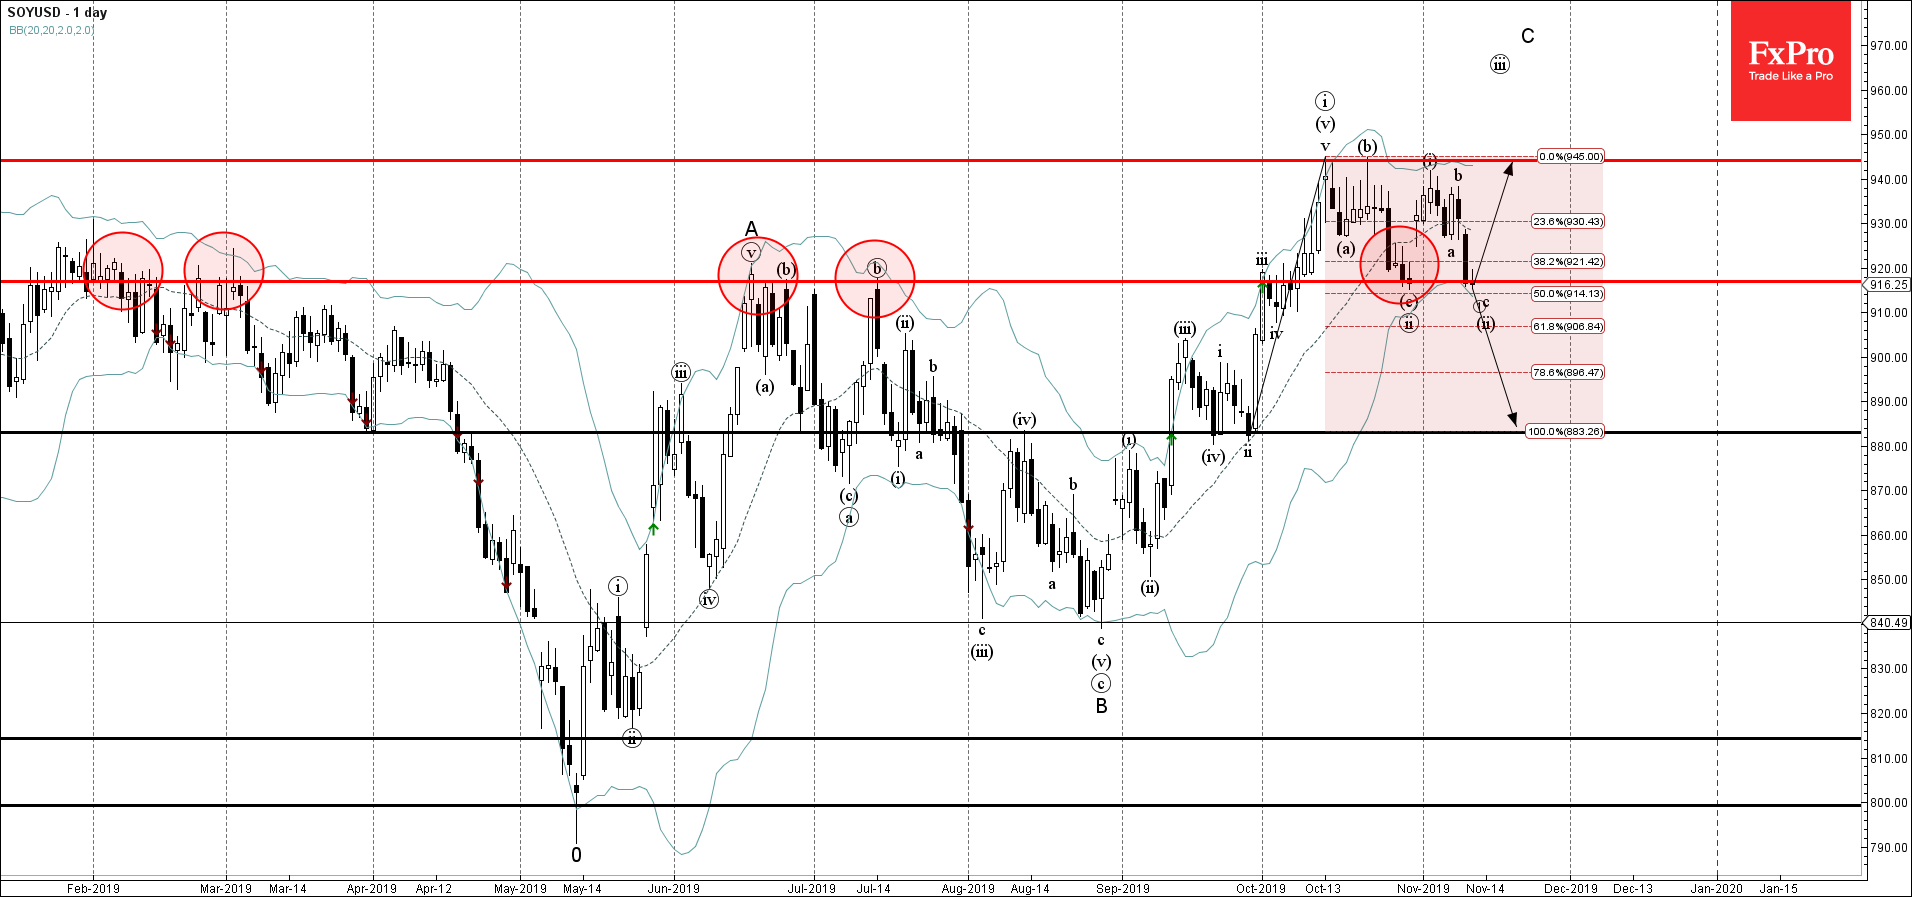
  • Soy trading close to support area
  • Likely to rise to 944.00

Soy recently corrected down and is currently trading close to support area lying between the support level 917.00 (low of wave (ii)) and the 50% Fibonacci correction of the previous upward impulse from September.

If the price breaks this support zone – Soy can then fall further to the next strong support level 880.00.

In the alternative scenario, Soy is expected to reverse up from the current support area and retest the next key resistance level 944.00

The FxPro Tech Analysis Team

The FxPro technical experts prepare a daily analysis of the most active currency pairs (majors, crosses, exotics) and commodities. Selected instruments are reviewed on daily trends (D1, H4), using the active Elliott Wave setups, Japanese candlesticks, indicators, and support/resistance levels.

Share
Published by
The FxPro Tech Analysis Team
Tags: SOYUSD

Recent Posts

Ebay Wave Analysis 30 April 2024

- Ebay under the bearish pressure - Likely to fall to support level 51.00 Ebay…

10 hours ago

GBPAUD Wave Analysis 30 April 2024

- GBPAUD reversed from key support level 1.9135 - Likely to rise to resistance level…

10 hours ago

Silver: a possible long road down

Silver has lost 2.6% since the start of the day on Tuesday to $26.4 per…

13 hours ago

Another Dip in Crypto Capitalization

Market picture  The crypto market capitalisation decreased by another 1.5% to $2.27 trillion, getting closer…

17 hours ago

ANF Wave Analysis 29 April 2024

ANF reversed from key support level 113.40 Likely to rise to resistance level 132.31 ANF…

1 day ago

GBPUSD Wave Analysis 29 April 2024

- GBPUSD rising inside minor correction 2 - Likely to rise to resistance level 1.2700…

1 day ago

This website uses cookies