Categories: Technical analysis

Soy Wave Analysis – 11 October, 2019

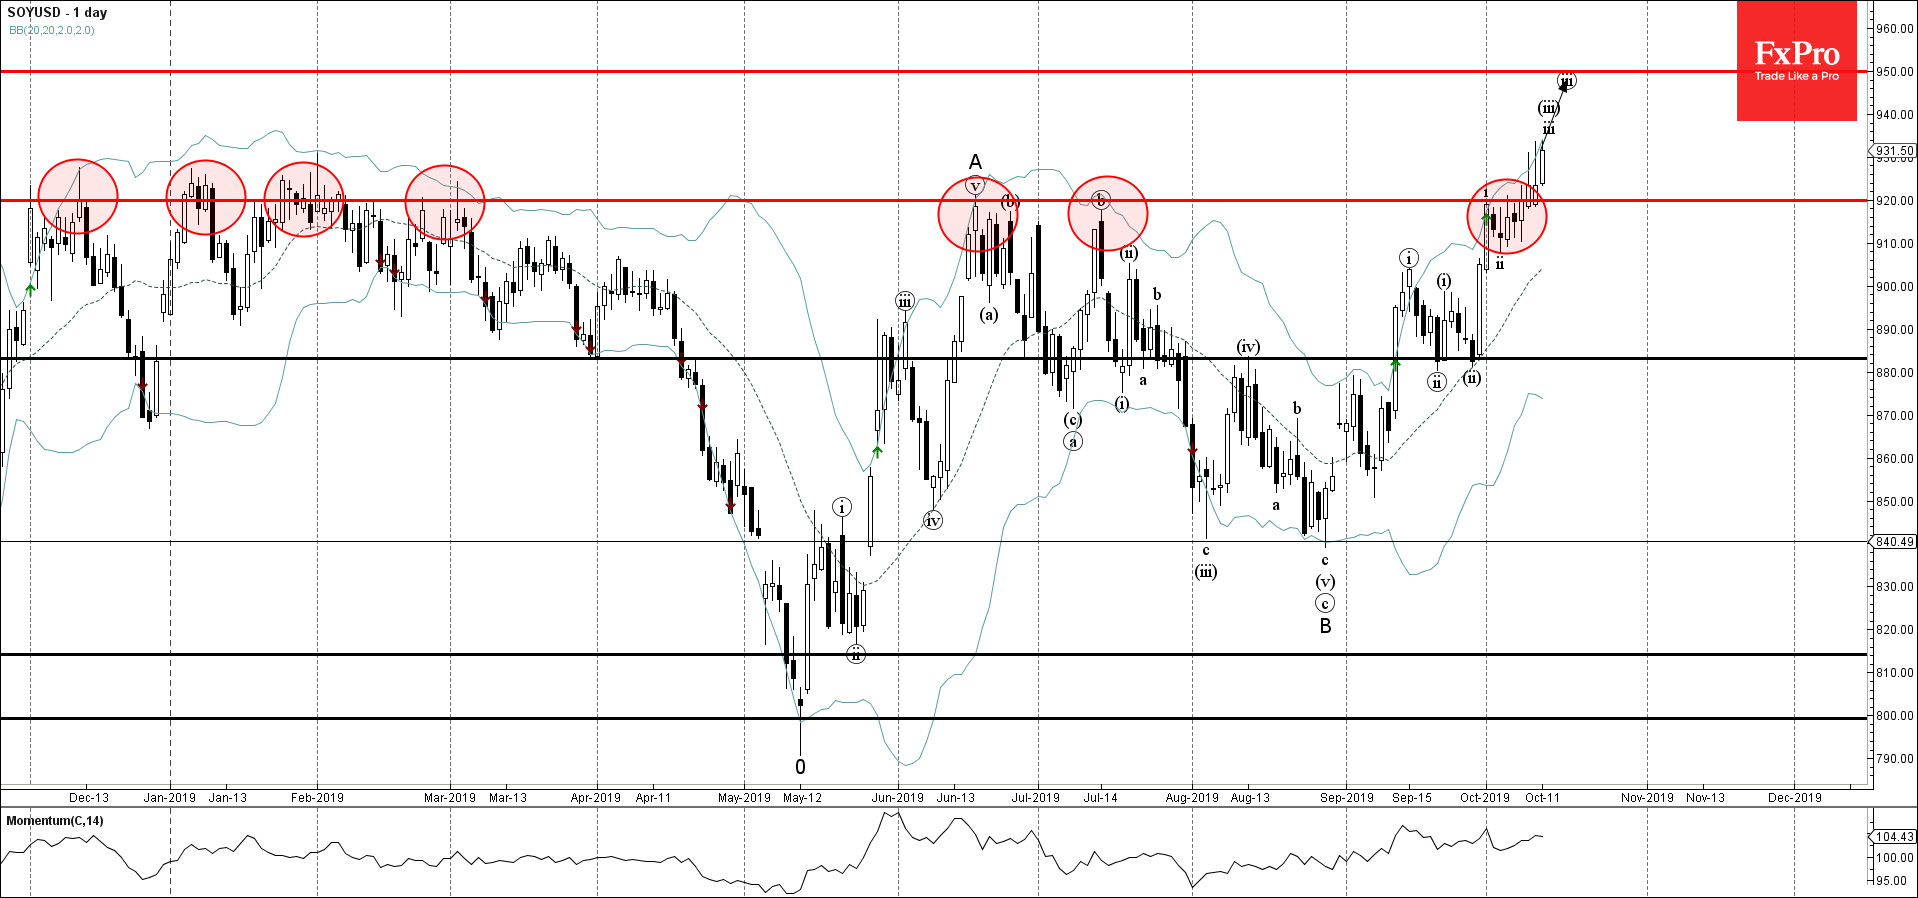
  • Soy broke multi-month resistance level 920.00
  • Likely to rise to 950.00

Soy recently broke the multi-month resistance level 920.00 – which has been steadily reversing the price from December of 2018.

The breakout of this resistance level accelerated the active short-term impulse wave (iii) – which belongs to the impulse sequence C from August.

Soy is expected to rise further and retest the next resistance level 950.00 (forecast price calculated for the completion of the active impulse wave (iii)).

AddThis Website Tools
The FxPro Tech Analysis Team

The FxPro technical experts prepare a daily analysis of the most active currency pairs (majors, crosses, exotics) and commodities. Selected instruments are reviewed on daily trends (D1, H4), using the active Elliott Wave setups, Japanese candlesticks, indicators, and support/resistance levels.

Share
Published by
The FxPro Tech Analysis Team
Tags: SOYUSD

Recent Posts

Pfizer Wave Analysis – 27 March 2025

Pfizer: ⬇️ Sell - Pfizer broke support level 25.20 - Likely to fall to support level…

9 minutes ago

Silver Wave Analysis – 27 March 2025

Silver: ⬆️ Buy - Silver broke resistance area - Likely to rise to resistance level…

10 minutes ago

EURGBP Wave Analysis – 27 March 2025

EURGBP: ⬇️ Sell - EURGBP broke support area - Likely to fall to support level…

5 hours ago

3M Wave Analysis – 27 March 2025

3M: ⬇️ Sell - 3M reversed from resistance area - Likely to fall to support…

5 hours ago

Smashed Hopes for US Stocks Recovery

The US stock market faced resistance from new auto tariffs and concerns about global response,…

7 hours ago

Gold and Silver about to break the ceiling

Gold has experienced growth, reaching historical highs due to new tariff wars. Silver has also…

9 hours ago