Categories: Technical analysis

Soy Wave Analysis – 10 March, 2020

  • Soy reversed from support area
  • Likely to rise to 890.00

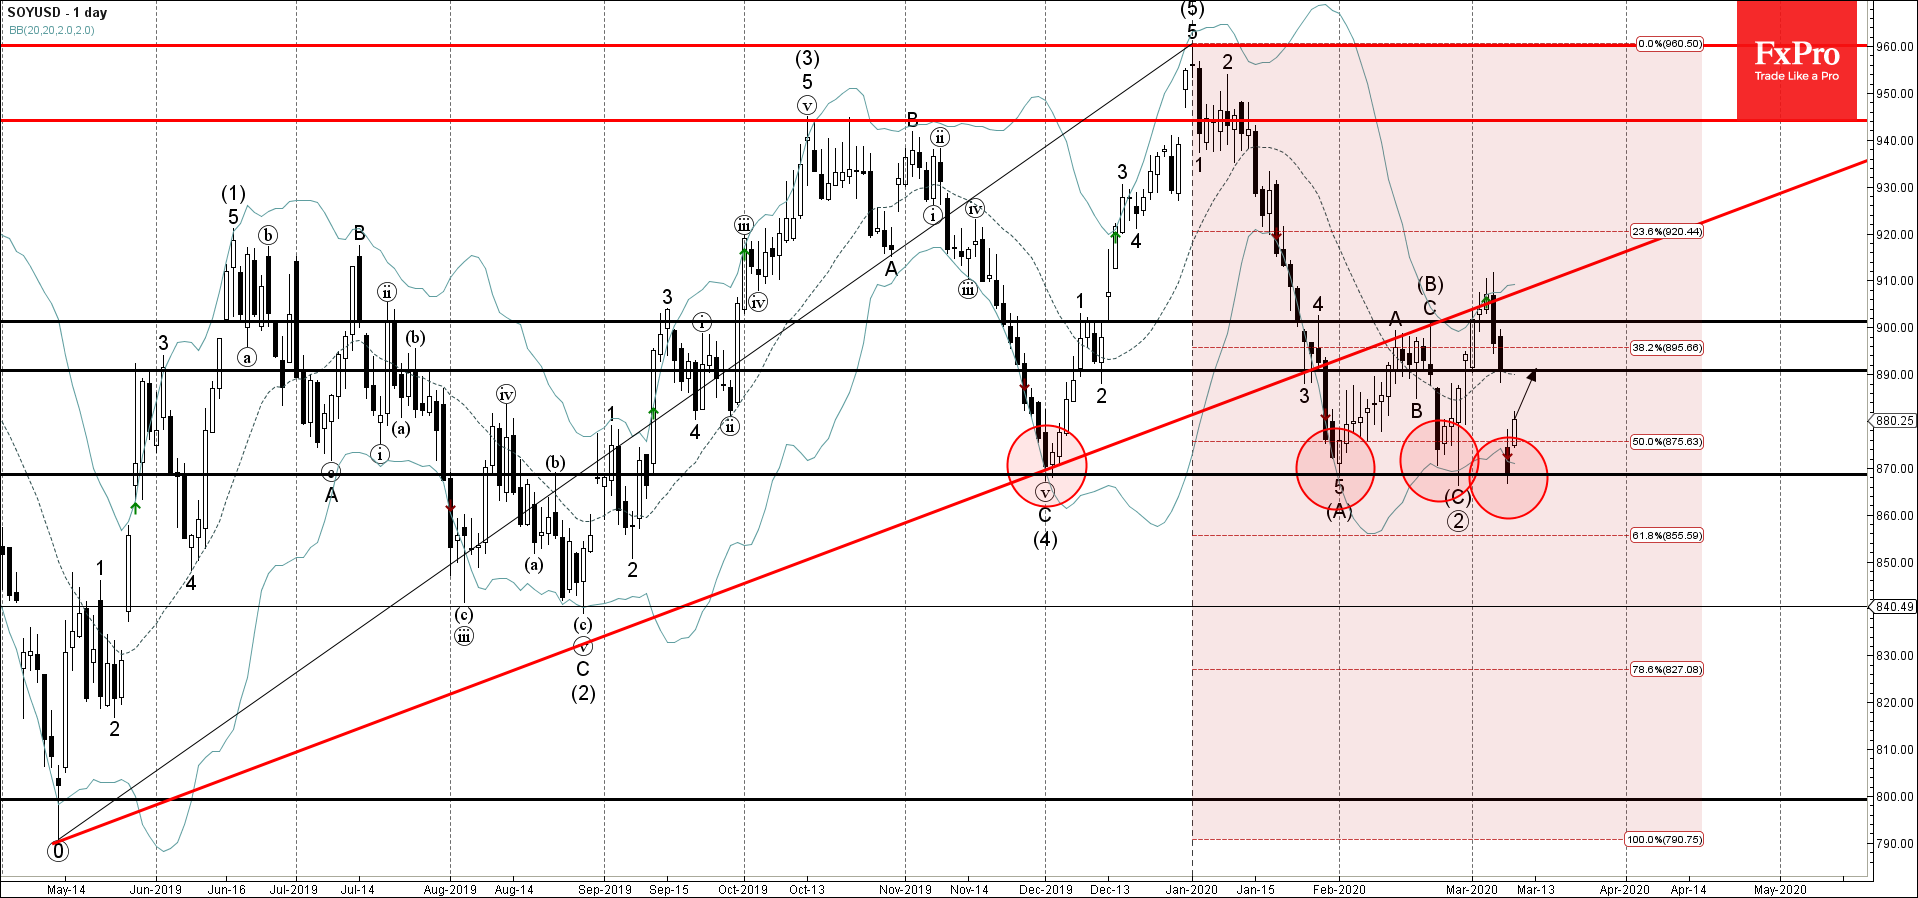
Soy recently reversed up from the support zone located between the powerful multi-month support level 870.00 (which has been reversing the price from November), lower daily Bollinger Band and the 50% Fibonacci retracement of the previous upward impulse from May of 2019.

The upward reversal from this support area is aligned with the prevailing uptrend visible on the daily Soy charts.

Soy is likely to rise further toward the next resistance level 890.00. Strong support remains at the support level 870.00.

The FxPro Tech Analysis Team

The FxPro technical experts prepare a daily analysis of the most active currency pairs (majors, crosses, exotics) and commodities. Selected instruments are reviewed on daily trends (D1, H4), using the active Elliott Wave setups, Japanese candlesticks, indicators, and support/resistance levels.

Share
Published by
The FxPro Tech Analysis Team
Tags: SOYUSD

Recent Posts

Markets pick up signals from the White House

Donald Trump has no intention of dismissing Jerome Powell. The White House's decision to postpone…

11 minutes ago

Bitcoin aims to break out of a corrective rebound

Crypto market rebounds, Bitcoin eyes $100K, Dash surges, institutional demand rises, and Ethereum staking hits…

36 minutes ago

Bitcoin Wave Analysis – 14 January 2026

Bitcoin: ⬆️ Buy - Bitcoin broke resistance area - Likely to rise to resistance level…

15 hours ago

NZDJPY Wave Analysis – 14 January 2026

NZDJPY: ⬇️ Sell - NZDJPY reversed down from the resistance area - Likely to fall…

15 hours ago

What is Leverage?

Leverage is a mechanism that lets traders control larger positions using smaller capital. By choosing…

20 hours ago

The dollar does not tolerate dissent

US GDP growth is driven not by the White House, but by AI. The Bank…

1 day ago

This website uses cookies