Categories: Technical analysis

Soy Wave Analysis – 06 March, 2020

  • Soy reversed from round resistance level 900.00
  • Likely to fall to 880.00

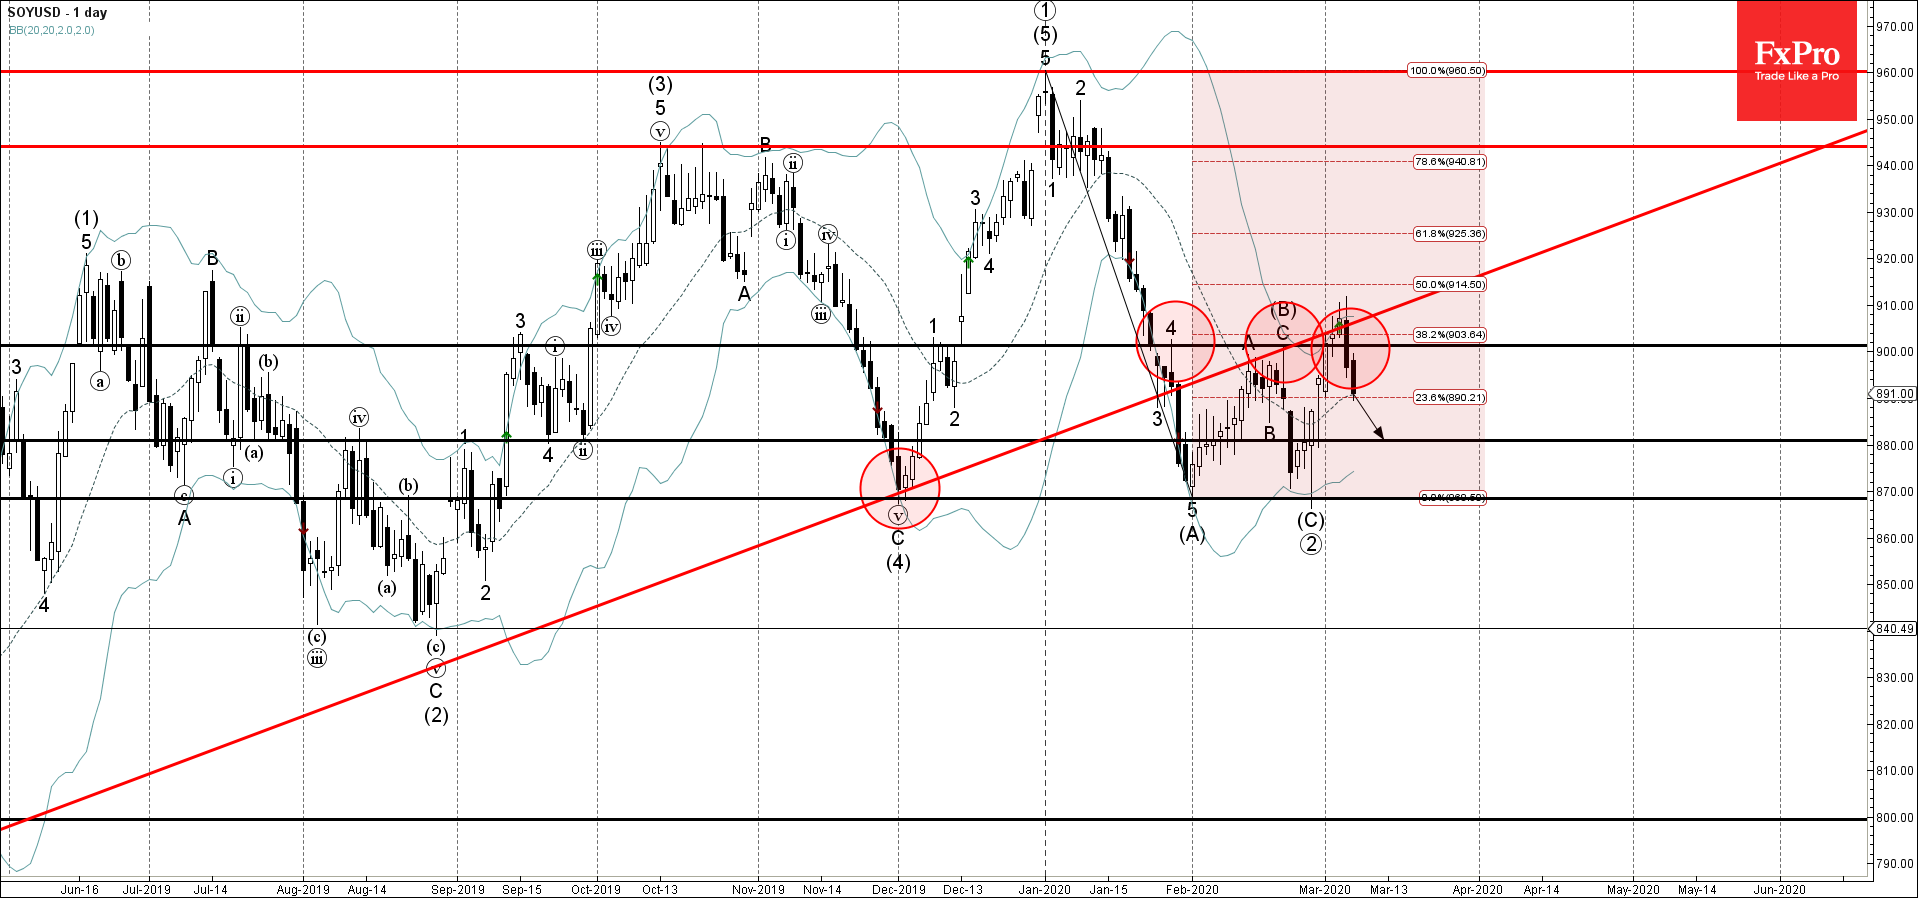
Soy recently reversed down with the daily Bearish Engulfing from the round resistance level 900.00 (which has been reversing the price from the end of January).

The resistance zone near the resistance level 900.00 was strengthened by the uptrend line from 2019, upper daily Bollinger Band and by the 38.2% Fibonacci correction of the pervious downward wave (A).

Soy is likely fall toward the next support level 880.00 – the breakout of which can lead to further losses toward the next strong support level 870.00.

The FxPro Tech Analysis Team

The FxPro technical experts prepare a daily analysis of the most active currency pairs (majors, crosses, exotics) and commodities. Selected instruments are reviewed on daily trends (D1, H4), using the active Elliott Wave setups, Japanese candlesticks, indicators, and support/resistance levels.

Share
Published by
The FxPro Tech Analysis Team
Tags: SOYUSD

Recent Posts

Bitcoin aims to break out of a corrective rebound

Crypto market rebounds, Bitcoin eyes $100K, Dash surges, institutional demand rises, and Ethereum staking hits…

18 minutes ago

Bitcoin Wave Analysis – 14 January 2026

Bitcoin: ⬆️ Buy - Bitcoin broke resistance area - Likely to rise to resistance level…

15 hours ago

NZDJPY Wave Analysis – 14 January 2026

NZDJPY: ⬇️ Sell - NZDJPY reversed down from the resistance area - Likely to fall…

15 hours ago

What is Leverage?

Leverage is a mechanism that lets traders control larger positions using smaller capital. By choosing…

20 hours ago

The dollar does not tolerate dissent

US GDP growth is driven not by the White House, but by AI. The Bank…

1 day ago

The crypto market has made a breakthrough

The crypto market surges, hitting new highs, with bullish sentiment for Bitcoin and Ethereum amid…

1 day ago

This website uses cookies