Categories: Technical analysis

Solana Wave Analysis – 9 June 2025

Solana: ⬆️ Buy

– Solana reversed from the support zone

– Likely to rise to the resistance level 163.80

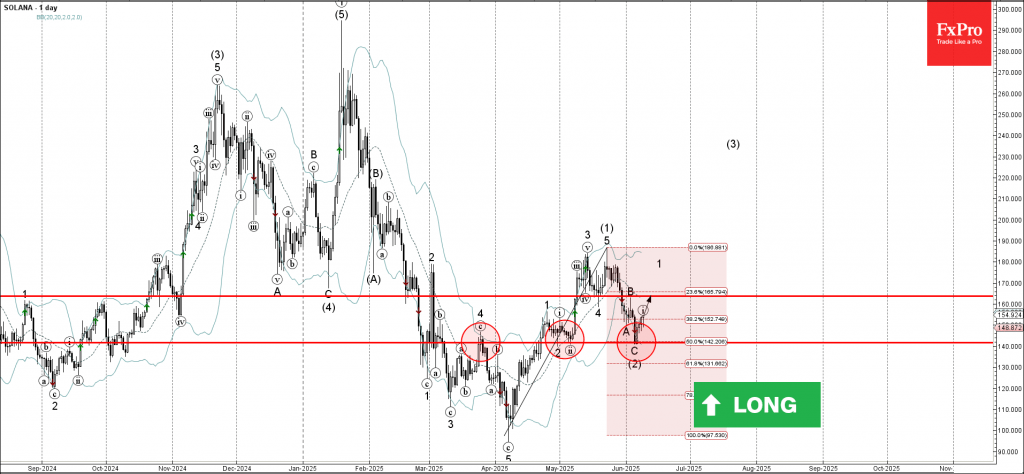
Solana cryptocurrency recently reversed up from the support zone between the key support level 141.65  (which has been reversing the price from April), lower daily Bollinger Band and the 50% Fibonacci correction of the upward impulse (1) from April.

The upward reversal from this support zone created the daily Japanese candlesticks reversal pattern, the Piercing Line.

Given the improved sentiment across the cryptocurrency markets, Solana can be expected to rise to the next resistance level 163.80 (top of the previous wave B).

The FxPro Tech Analysis Team

The FxPro technical experts prepare a daily analysis of the most active currency pairs (majors, crosses, exotics) and commodities. Selected instruments are reviewed on daily trends (D1, H4), using the active Elliott Wave setups, Japanese candlesticks, indicators, and support/resistance levels.

Share
Published by
The FxPro Tech Analysis Team
Tags: Solana

Recent Posts

EURAUD Wave Analysis – 6 January 2026 Wave Analysis – 6 January 2026

EURAUD: ⬇️ Sell - EURAUD broke strong support level 1.7465 - Likely to fall to…

1 hour ago

IBM Wave Analysis – 6 January 2026

IBM: ⬆️ Buy - IBM reversed from support zone - Likely to rise to resistance…

1 hour ago

Palladium Wave Analysis – 6 January 2026

Palladium: ⬆️ Buy - Palladium reversed from round support level 1600.00 - Likely to rise…

1 hour ago

Amazon Wave Analysis – 6 January 2026

Amazon: ⬆️ Buy - Amazon broke resistance zone - Likely to rise to resistance level…

1 hour ago

Pro News Flash: Gold Bulls Take Control

🥇 Gold is regaining momentum as investors lean into geopolitics, a softer US dollar and…

7 hours ago

The dollar is forced to retreat

• The reduction in geopolitical risks in Venezuela has weakened the greenback. •  Precious metal investors…

11 hours ago

This website uses cookies