Categories: Technical analysis

Solana Wave Analysis – 2 December 2025

Solana: ⬆️ Buy

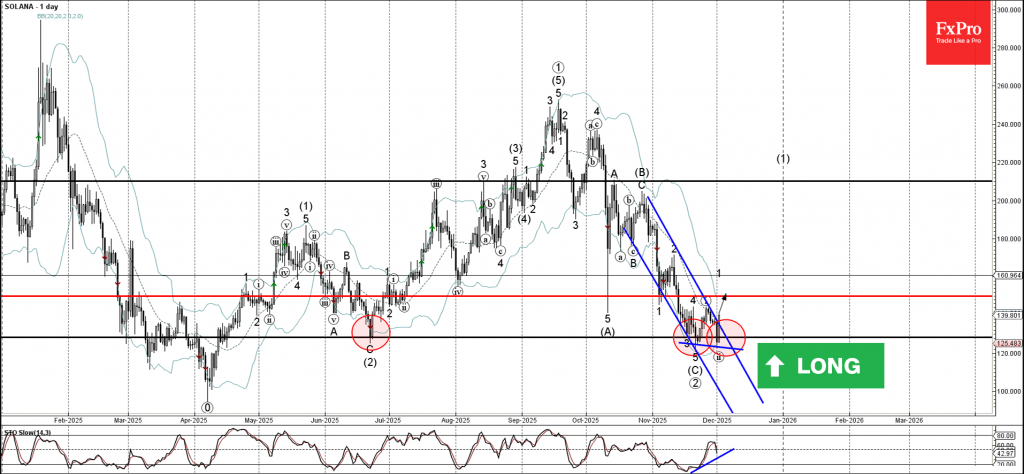
– Solana reversed from long-term support level 128.30

– Likely to rise to resistance level 150.000

Solana cryptocurrency recently reversed from the support zone between the long-term support level 128.30 (which has been reversing the price from June) and the lower daily Bollinger Band.

The upward reversal from this support zone is likely to form the daily Japanese candlesticks reversal pattern Bullish Engulfing.

Given the recent breakout of the daily down channel from October and the bullish divergence on the daily Stochastic indicator, Solana cryptocurrency can be expected to rise to the next resistance level 150.000.

The FxPro Tech Analysis Team

The FxPro technical experts prepare a daily analysis of the most active currency pairs (majors, crosses, exotics) and commodities. Selected instruments are reviewed on daily trends (D1, H4), using the active Elliott Wave setups, Japanese candlesticks, indicators, and support/resistance levels.

Share
Published by
The FxPro Tech Analysis Team
Tags: Solana

Recent Posts

NZDCAD Wave Analysis – 7 January 2026

NZDCAD: ⬆️ Buy - NZDCAD reversed from support zone - Likely to rise to resistance…

4 hours ago

Bitcoin Wave Analysis – 7 January 2026

Bitcoin: ⬇️ Sell - Bitcoin reversed from resistance zone - Likely to fall to support…

4 hours ago

EURGBP Wave Analysis – 7 January 2026

EURGBP: ⬆️ Buy - EURGBP reversed from support zone - Likely to rise to resistance…

4 hours ago

Brent Crude Oil Wave Analysis – 7 January 2026

Brent Crude Oil: ⬇️ Sell - Brent Crude Oil reversed from resistance zone - Likely…

4 hours ago

Old fears about the euro have returned

The resurgence of the political crisis in France is weighing on EURUSD The US dollar…

13 hours ago

The crypto market has hit the upper limit of its rebound

The crypto market faces resistance at $3.2T; sentiment rises, but selling pressure persists. Bitcoin and…

16 hours ago

This website uses cookies