Categories: Technical analysis

Silver Wave Analysis – 27 August, 2019

  • Silver broke resistance area
  • Further gains are likely

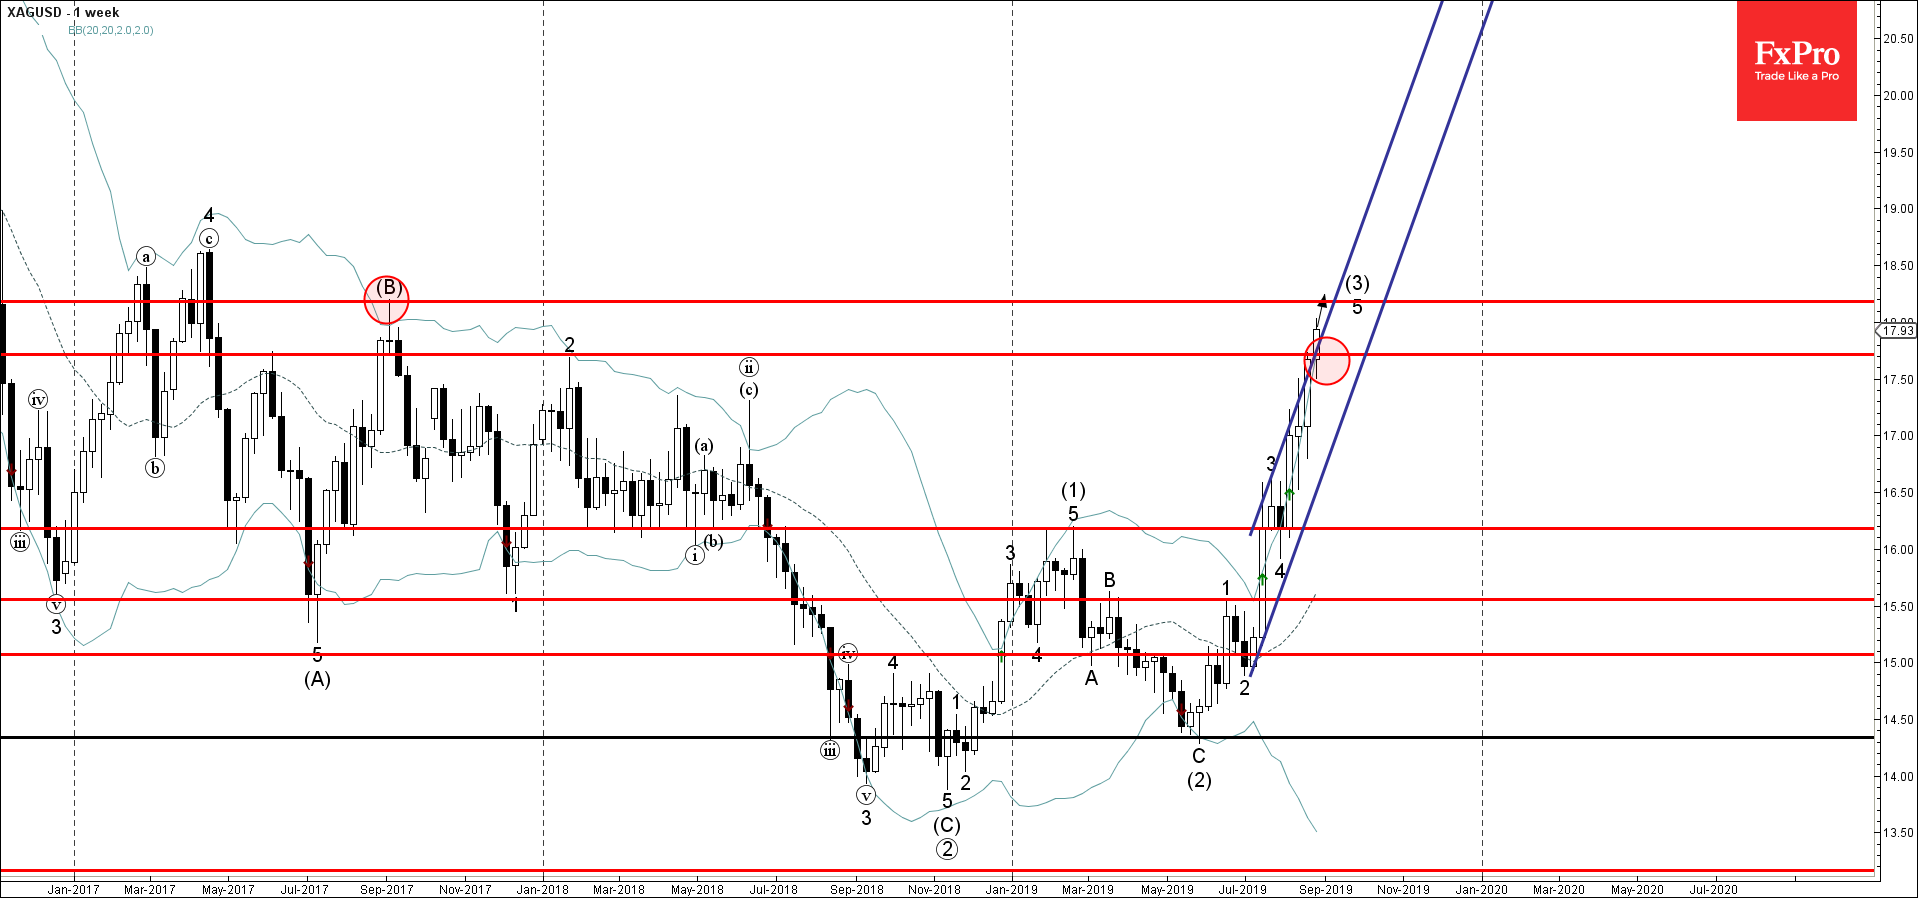
Silver recently broke the resistance area located between the long-term resistance level 17.70 (yearly high from 2018) and the resistance trendline of the weekly up channel from July.

The breakout of this resistance area accelerated the active medium-term impulse wave (3).

Silver is expected to rise further and retest the next resistance level 18.20 (top of the previous wave (B) from 2017).

The FxPro Tech Analysis Team

The FxPro technical experts prepare a daily analysis of the most active currency pairs (majors, crosses, exotics) and commodities. Selected instruments are reviewed on daily trends (D1, H4), using the active Elliott Wave setups, Japanese candlesticks, indicators, and support/resistance levels.

Share
Published by
The FxPro Tech Analysis Team
Tags: XAGUSD

Recent Posts

Solana Wave Analysis – 18 March 2025

Solana: ⬇️ Sell - Solana reversed from the resistance zone - Likely to fall to…

59 minutes ago

CHFJPY Wave Analysis – 18 March 2025

CHFJPY: ⬆️ Buy - CHFJPY broke resistance zone - Likely to rise to resistance level…

1 hour ago

The crypto market is stuck in the mud

Market Picture The crypto market has been hovering in a narrow range for the past…

6 hours ago

FTSE 100 Wave Analysis – 17 March 2025

FTSE 100: ⬆️ Buy - FTSE 100 reversed from key support level 8425.00 - Likely…

22 hours ago

Alibaba Wave Analysis – 17 March 2025

Alibaba: ⬆️ Buy - Alibaba broke the key resistance level 145.00 - Likely to rise…

22 hours ago

EURNZD Wave Analysis – 17 March 2025

EURNZD: ⬇️ Sell - EURNZD reversed from long-term resistance level 1.9160 - Likely to fall…

1 day ago

This website uses cookies