Categories: Technical analysis

Silver Wave Analysis – 25 February, 2020

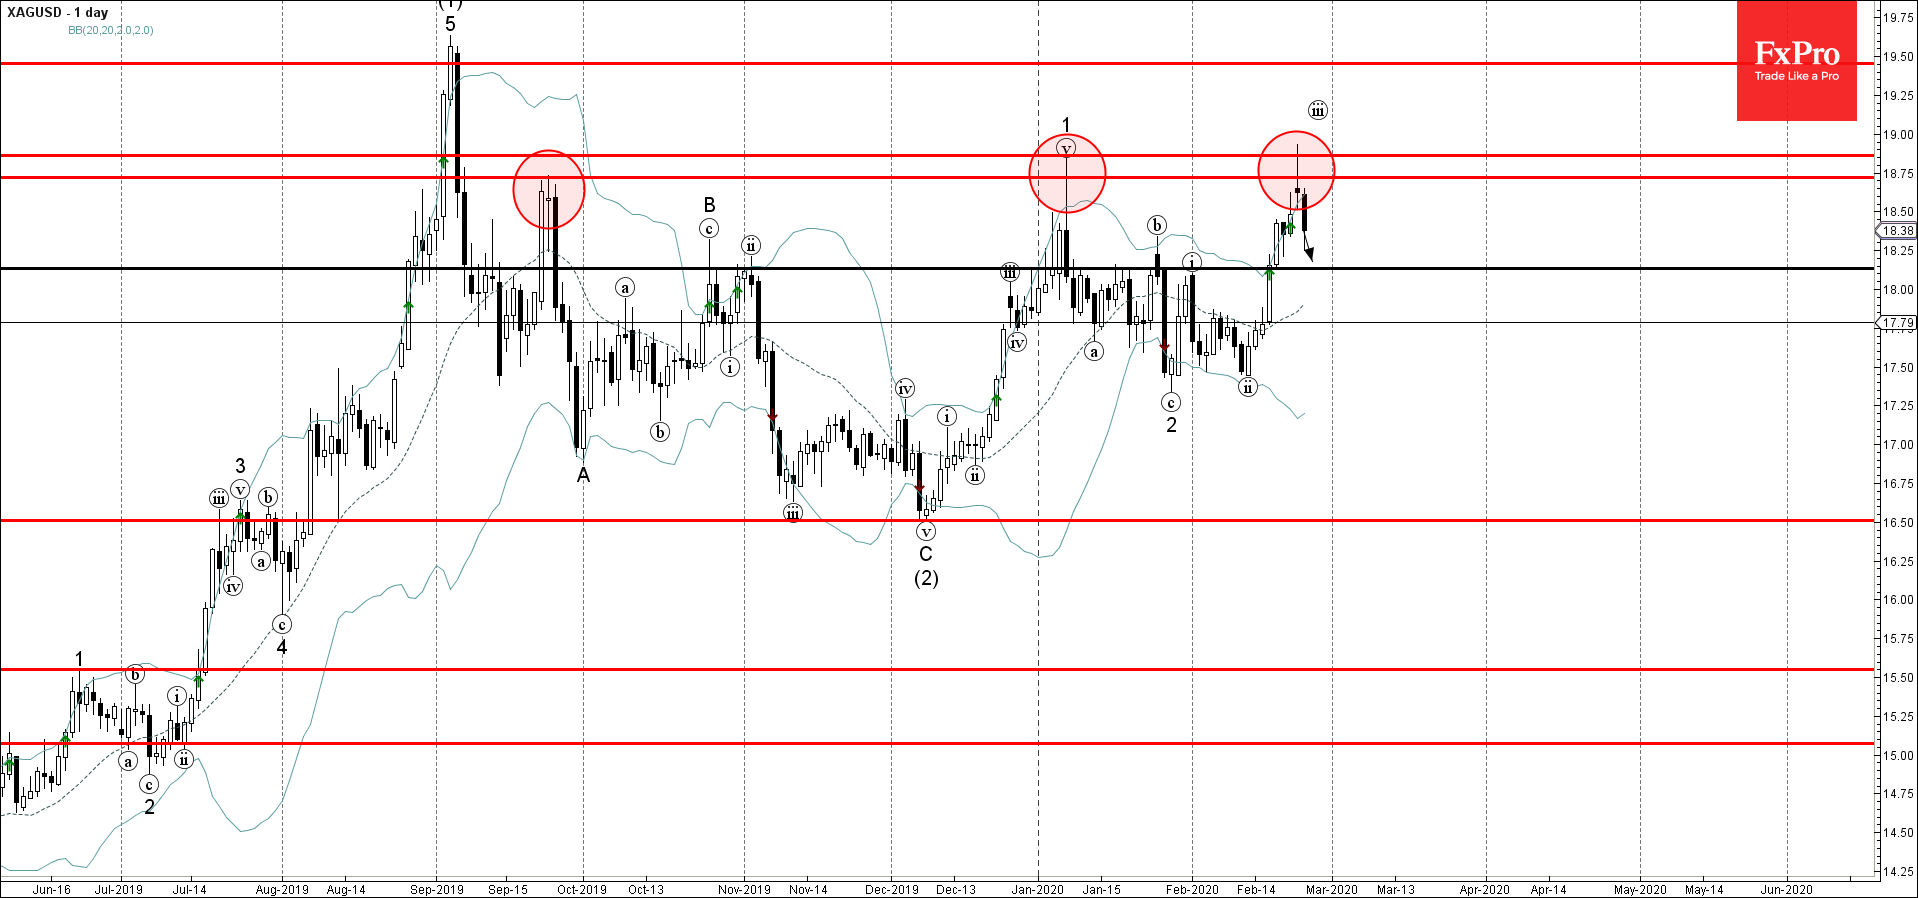
  • Silver reversed from resistance area
  • Likely to fall to 18.15

Silver recently reversed down sharply from the resistance area located between the resistance level 18.750 (top of the daily Evening Star from September), resistance level 18.85 (top of the previous impulse wave 1) and the upper daily Bollinger Band.

The downward reversal from this resistance area created the daily candlesticks reversal pattern Shooting Star Doji – standing well above the upper Bollinger Band.

Silver is likely to fall further toward the next support level 18.15 (former top of the earlier impulse wave (i) from last month).

The FxPro Tech Analysis Team

The FxPro technical experts prepare a daily analysis of the most active currency pairs (majors, crosses, exotics) and commodities. Selected instruments are reviewed on daily trends (D1, H4), using the active Elliott Wave setups, Japanese candlesticks, indicators, and support/resistance levels.

Share
Published by
The FxPro Tech Analysis Team
Tags: XAGUSD

Recent Posts

Pro News Weekly: Market Shake-Up, Dollar Drops, Gold Surges, Bitcoin Wobbles!

Welcome to Pro News Flash! 💵 The U.S. dollar slips 🏆 Major stock indices struggle…

4 hours ago

Solana Wave Analysis – 5 December 2025

Solana: ⬇️ Sell - Solana reversed from resistance zone - Likely to fall to support…

5 hours ago

EURAUD Wave Analysis – 5 December 2025

EURAUD : ⬇️ Sell - EURAUD broke the support level 1.7600 - Likely to fall…

5 hours ago

Forex has set its priorities

In 2026, experts favour the yen, see modest euro growth, and expect pressure on the…

10 hours ago

Bear market rebound in crypto is likely to continue

Crypto rebounds continue; Bitcoin faces resistance, with a mixed market outlook ahead, as regulatory changes…

11 hours ago

Coca-Cola Wave Analysis – 4 December 2025

Coca-Cola: ⬇️ Sell - Coca-Cola reversed from long-term resistance level 73.25 - Likely to fall to…

24 hours ago

This website uses cookies