Categories: Technical analysis

Silver Wave Analysis – 23 June, 2020

• Silver reversed from support zone
• Likely to rise 18.35

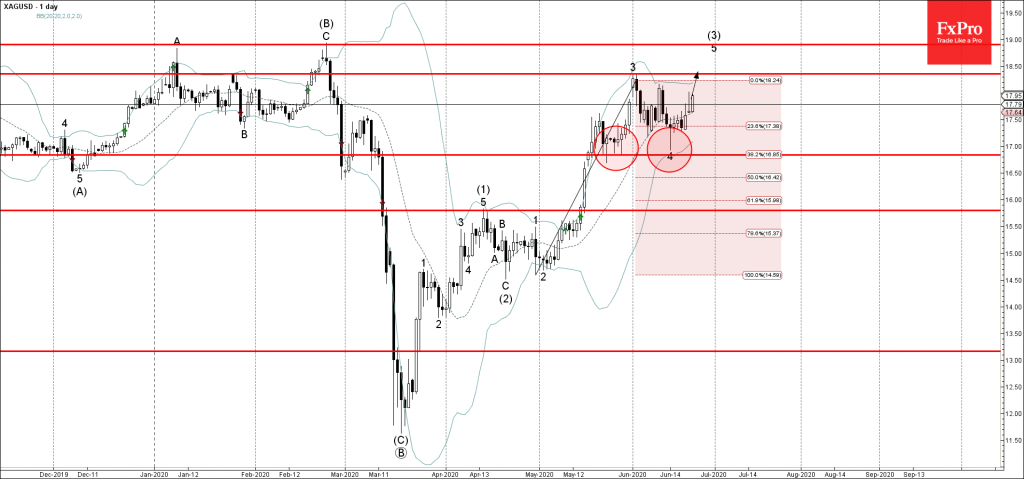
Silver recently reversed up from the support area lying at the intersection of the key support level 17.00 (multi-candle low from the end of May), lower daily Bollinger band and the 38.2% Fibonacci retracement of the previous upward impulse from the end of April.

The upward reversal from this support zone created the daily candlesticks reversal pattern Hammer – which started the active impulse wave 5.

Silver is likely to rise further toward the next resistance level 18.35 (which stopped previous impulse wave 3 at the start of June).

The FxPro Tech Analysis Team

The FxPro technical experts prepare a daily analysis of the most active currency pairs (majors, crosses, exotics) and commodities. Selected instruments are reviewed on daily trends (D1, H4), using the active Elliott Wave setups, Japanese candlesticks, indicators, and support/resistance levels.

Share
Published by
The FxPro Tech Analysis Team
Tags: XAGUSD

Recent Posts

CHFJPY Wave Analysis – 15 January 2026

CHFJPY: ⬇️ Sell - CHFJPY reversed from resistance zone - Likely to fall to support level…

12 hours ago

WTI Crude Oil Wave Analysis – 15 January 2026

WTI Crude Oil: ⬇️ Sell - WTI Crude Oil rising inside minor impulse wave (1) -…

12 hours ago

Costco Wave Analysis – 15 January 2026

Costco: ⬆️ Buy - Costco rising inside minor impulse wave (1) - Likely to reach resistance…

12 hours ago

Chevron Wave Analysis – 15 January 2026

Chevron: ⬆️ Buy - Chevron broke strong resistance level 165.00 - Likely to rise to resistance…

12 hours ago

US Indices: growth widens, but are expectations too high?

Tech sell-off and high Q4 forecasts put the S&P 500 at risk; the Russell 2000…

18 hours ago

Markets pick up signals from the White House

Donald Trump has no intention of dismissing Jerome Powell. The White House's decision to postpone…

21 hours ago

This website uses cookies