Categories: Technical analysis

Silver Wave Analysis – 21 July, 2020

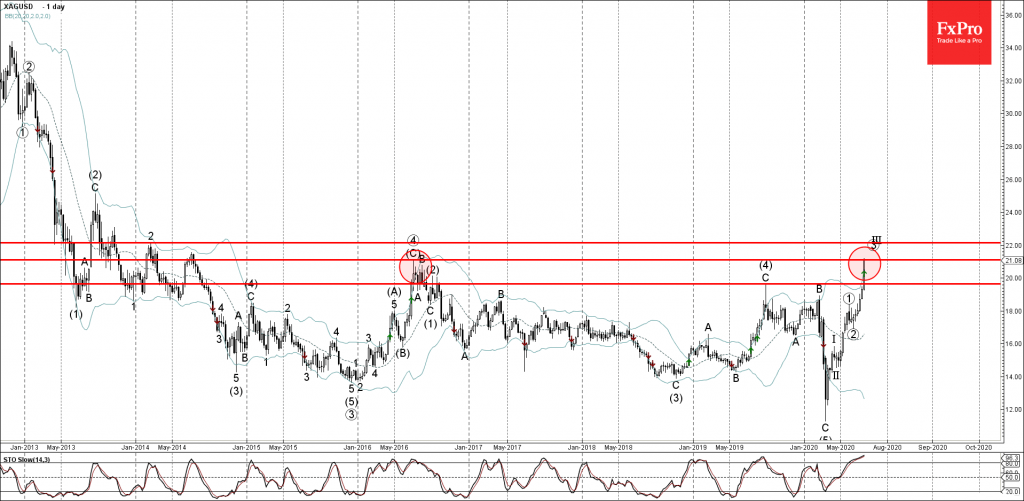
• Silver approached long-term resistance level 21.1

• Likely to correct to 19.65

Silver has been rising sharply after the earlier breakout of the key multi-month resistance level 19.65 (which stopped the previous weekly correction (4) in 2019).

The price is currently trading close to the powerful long-term resistance level 21.1 (former multi-year resistance from 2016). Subsequent price action will depend on if the price will be able to break above this resistance level.

With the weekly Stochastic far in the overbought territory – Silver is likely to correct down toward the next support level 19.65). Alternatively – the price can test 22.00.

The FxPro Tech Analysis Team

The FxPro technical experts prepare a daily analysis of the most active currency pairs (majors, crosses, exotics) and commodities. Selected instruments are reviewed on daily trends (D1, H4), using the active Elliott Wave setups, Japanese candlesticks, indicators, and support/resistance levels.

Share
Published by
The FxPro Tech Analysis Team
Tags: Silver

Recent Posts

Brent Crude oil Wave Analysis – 13 January 2026

Brent Crude oil ⬆️ Buy - Brent Crude oil rising inside impulse wave c -…

11 hours ago

USDJPY Wave Analysis – 13 January 2026

USDJPY ⬆️ Buy - USDJPY broke resistance area - Likely to rise to resistance level…

11 hours ago

Exxon Mobil Wave Analysis – 13 January 2026

Exxon Mobil ⬆️ Buy - Exxon Mobil broke resistance level 125.60 - Likely to rise…

11 hours ago

BNB Wave Analysis – 13 January 2026

Brent Crude oil ⬆️ Buy - BNB broke out of sideways price range - Likely…

11 hours ago

A slightly weaker CPI was not enough to break through the highs

US CPI data a bit softer than forecasts, sparking brief market optimism, but resistance remains.…

17 hours ago

Pro News Flash: Global Tensions Fuel a Fresh Oil Rally

🛢️ Oil prices are finding fresh strength as geopolitical tensions in the Middle East reignite…

17 hours ago

This website uses cookies