Categories: Technical analysis

Silver Wave Analysis – 16 September, 2019

  • Silver reversed from support zone
  • Further gains are likely

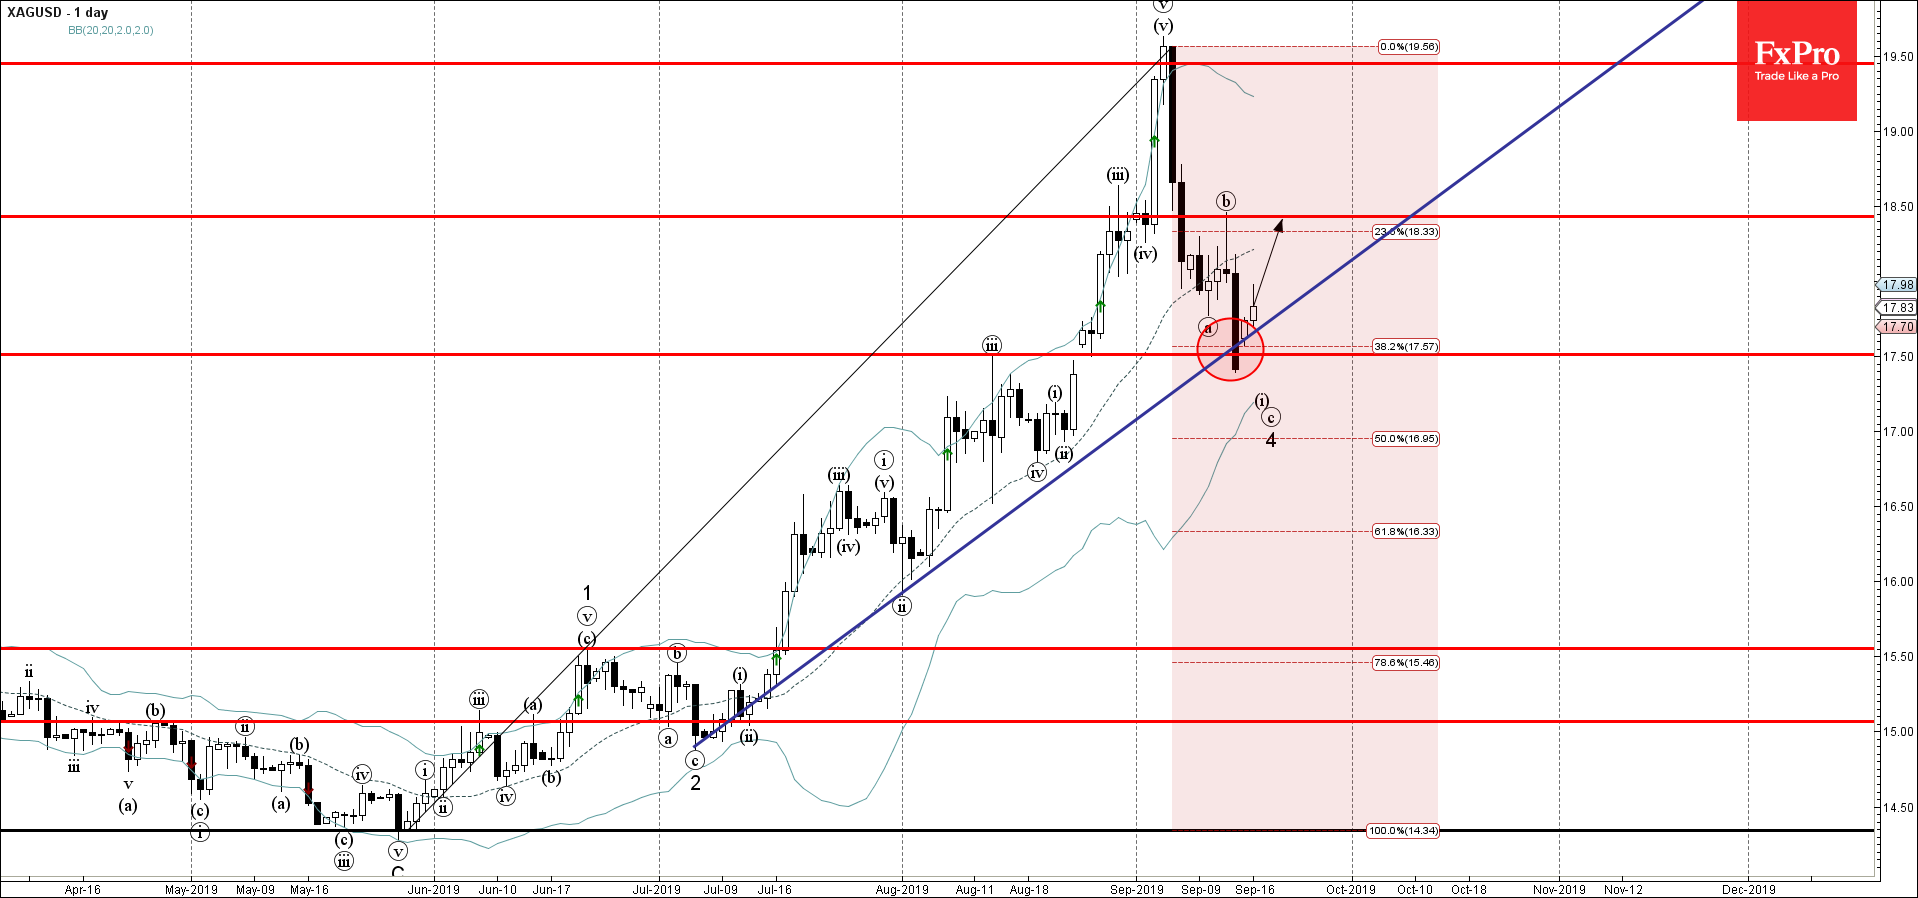
Silver recently reversed up from the support zone lying between the support level 17.50 (former pivotal resistance from August), the support trendline from July and the 38.2% Fibonacci correction of the previous upward impulse from May.

The upward reversal from this support zone stopped the earlier short-term impulse wave (c) of the ABC correction 4 from the start of September.

Silver is likely to extend the gains and retest the next resistance level 18.40 (top of the previous corrective wave (b)).

AddThis Website Tools
The FxPro Tech Analysis Team

The FxPro technical experts prepare a daily analysis of the most active currency pairs (majors, crosses, exotics) and commodities. Selected instruments are reviewed on daily trends (D1, H4), using the active Elliott Wave setups, Japanese candlesticks, indicators, and support/resistance levels.

Share
Published by
The FxPro Tech Analysis Team
Tags: XAGUSD

Recent Posts

Gold Wave Analysis – 19 March 2025

Gold: ⬆️ Buy - Gold continues daily uptrend - Likely to rise to resistance level…

2 hours ago

EURJPY Wave Analysis – 19 March 2025

EURJPY: ⬇️ Sell - EURJPY reversed from resistance zone - Likely to fall to support…

2 hours ago

NZDUSD Wave Analysis – 19 March 2025

NZDUSD: ⬇️ Sell - NZDUSD reversed from the resistance level 0.5820 - Likely to fall…

10 hours ago

EURUSD Wave Analysis – 19 March 2025

EURUSD: ⬇️ Sell - EURUSD reversed from resistance level 1.0930 - Likely to fall to…

10 hours ago

Ethereum gives way

The crypto market remains in a downtrend, with Ethereum losing market share while Bitcoin's share…

15 hours ago

GBPUSD Wave Analysis – 18 March 2025

GBPUSD: ⬆️ Buy - GBPUSD reversed from support zone - Likely to rise to resistance…

1 day ago