Categories: Technical analysis

Silver Wave Analysis – 16 November , 2018

  • Silver reversed from combined support area
  • Further gains are likely

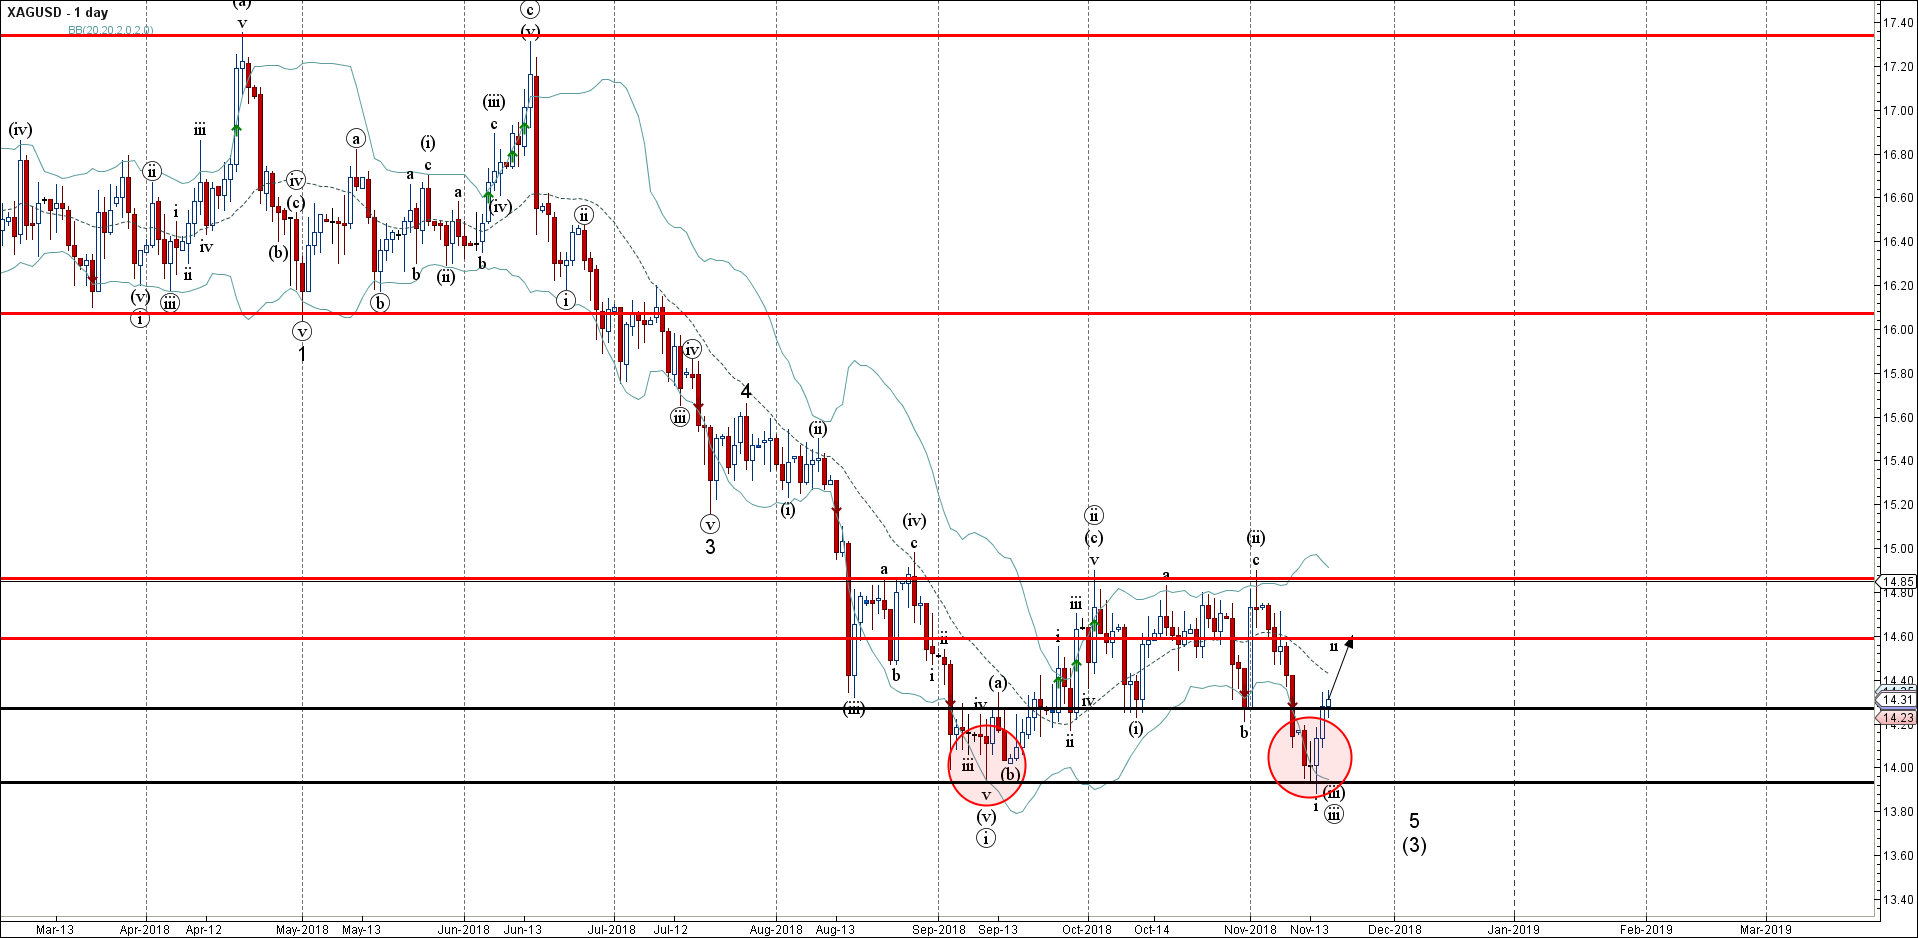
Silver recently reversed up from combined support area located between the key support level 13.90 (which also previously stopped the sharp downtrend in September) and the lower daily Bollinger Band.

The upward reversal from this support area created the daily Japanese candlesticks reversal pattern Morning Star, which stopped the previous sharp ABC correction ② from the start of October.

Silver is expected to rise further and re-test the next resistance level 14.600 (target price for the completion of eth active corrective wave ii).

The FxPro Tech Analysis Team

The FxPro technical experts prepare a daily analysis of the most active currency pairs (majors, crosses, exotics) and commodities. Selected instruments are reviewed on daily trends (D1, H4), using the active Elliott Wave setups, Japanese candlesticks, indicators, and support/resistance levels.

Share
Published by
The FxPro Tech Analysis Team
Tags: XAGUSD

Recent Posts

FTSE 100 Wave Analysis – 17 March 2025

FTSE 100: ⬆️ Buy - FTSE 100 reversed from key support level 8425.00 - Likely…

1 hour ago

Alibaba Wave Analysis – 17 March 2025

Alibaba: ⬆️ Buy - Alibaba broke the key resistance level 145.00 - Likely to rise…

1 hour ago

EURNZD Wave Analysis – 17 March 2025

EURNZD: ⬇️ Sell - EURNZD reversed from long-term resistance level 1.9160 - Likely to fall…

5 hours ago

AUDUSD Wave Analysis – 17 March 2025

AUDUSD: ⬆️ Buy - AUDUSD broke resistance level 0.6350 - Likely to rise to resistance…

5 hours ago

Weak US retail sales might boost stocks

Weak US retail sales are adding to concerns of a potential recession, putting pressure on…

8 hours ago

Dow Jones: Rebound or Rally? The Fed Holds the Key

The Dow Jones rebound depends on the Federal Reserve's monetary policy and incoming data. It…

9 hours ago

This website uses cookies