Categories: Technical analysis

Silver Wave Analysis 12 September 2024

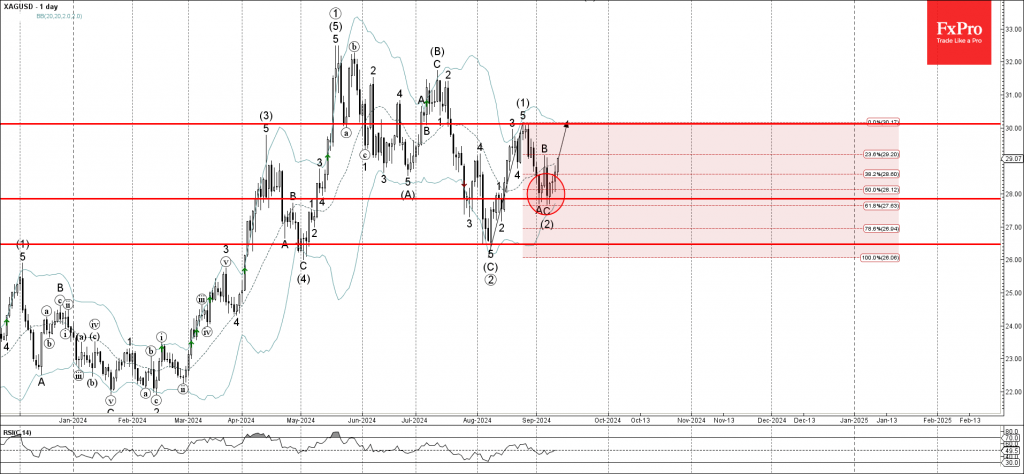
– Silver reversed from support zone

– Likely to rise to the resistance level 30.00

Silver recently reversed up from the support zone set between the key support level 28.00 (which also stopped wave A at the start of September) and the lower daily Bollinger Band.

The support level 28.00 was strengthened by the 61.8% Fibonacci correction of the upward impulse (1) from the start of August.

Silver can be expected to rise further to the next resistance level 30.00 (which stopped the previous impulse wave (1) at the end of August).

The FxPro Tech Analysis Team

The FxPro technical experts prepare a daily analysis of the most active currency pairs (majors, crosses, exotics) and commodities. Selected instruments are reviewed on daily trends (D1, H4), using the active Elliott Wave setups, Japanese candlesticks, indicators, and support/resistance levels.

Share
Published by
The FxPro Tech Analysis Team
Tags: Silver

Recent Posts

The Fed’s big rate and projections cut

The Fed cut the rate by 50 bps, This change was not fully factored into…

1 min ago

Crypto market climbs out of the pit

The crypto market as a whole and Bitcoin hit three-week highs, but are still in…

6 hours ago

AUDCAD Wave Analysis 18 September 2024

- AUDCAD broke pivotal resistance level 0.9170 - Likely to rise to resistance level 0.9260…

19 hours ago

WTI Wave Analysis 18 September 2024

- WTI reversed from round resistance level 70.00 - Likely to fall to support level…

19 hours ago

Strong data didn’t derail markets from expectations of a 50bp Fed cut

US retail sales rose 0.1% m/m in August, better than forecast, but sales growth in…

1 day ago

The crypto market gets a boost from stocks

Market Picture The crypto market has gained 2.1% in the last 24 hours to reach…

1 day ago

This website uses cookies