Categories: Technical analysis

Silver Wave Analysis – 09 September, 2019

  • Silver reversed from resistance area
  • Further losses are likely

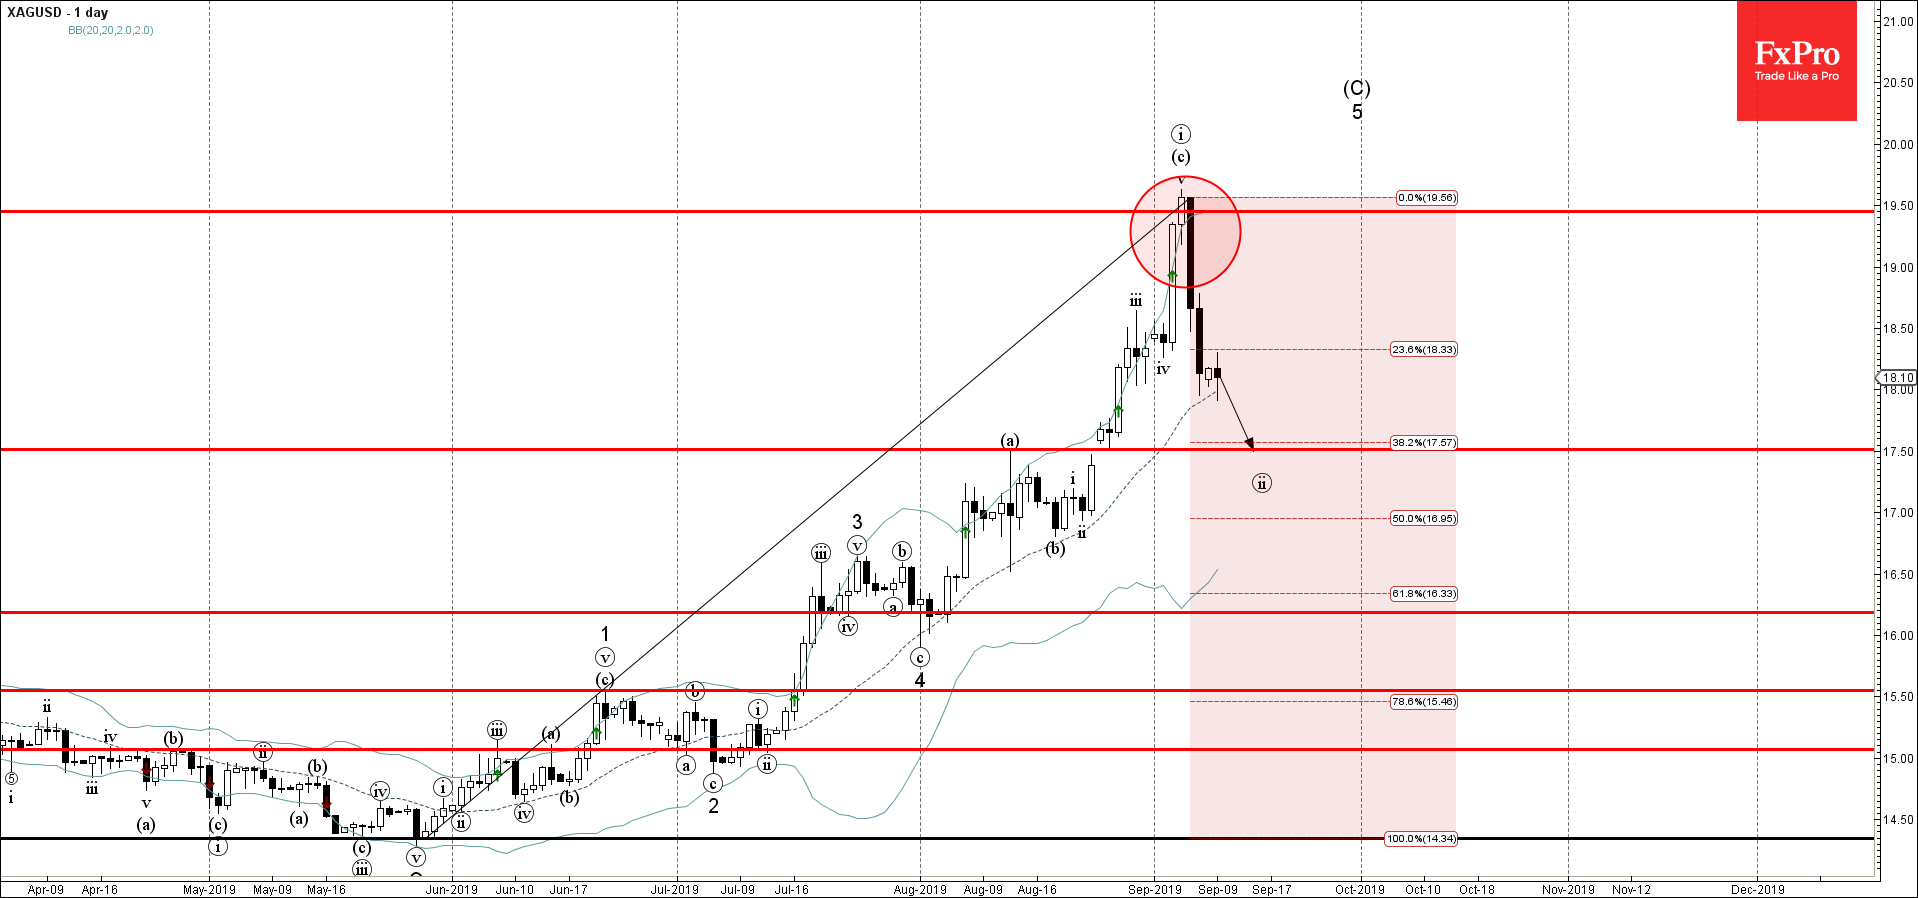
Silver recently reversed down from the resistance area lying between the resistance level 19.50 and the upper daily Bollinger Band.

The downward reversal from this resistance area created the daily Japanese candlesticks reversal pattern Evening Star – which marked the start of the active short-term ABC correction (ii).

Silver is expected to fall further and retest the next support level 17.50 (former resistance from August and the target price for the completion of the active ABC correction (ii)).

AddThis Website Tools
The FxPro Tech Analysis Team

The FxPro technical experts prepare a daily analysis of the most active currency pairs (majors, crosses, exotics) and commodities. Selected instruments are reviewed on daily trends (D1, H4), using the active Elliott Wave setups, Japanese candlesticks, indicators, and support/resistance levels.

Share
Published by
The FxPro Tech Analysis Team
Tags: XAGUSD

Recent Posts

Apple Wave Analysis – 20 March 2025

Apple: ⬇️ Sell - Apple reversed from resistance level 220.00 - Likely to fall to…

3 hours ago

IBM Wave Analysis – 20 March 2025

IBM: ⬆️ Buy - IBM reversed from support zone - Likely to rise to resistance…

3 hours ago

AUDNZD Wave Analysis – 20 March 2025

AUDNZD: ⬆️ Buy - AUDNZD reversed from key support level 1.0930 - Likely to rise…

6 hours ago

EURCAD Wave Analysis – 20 March 2025

EURCAD: ⬇️ Sell - EURCAD reversed from the resistance zone - Likely to fall to…

6 hours ago

Crypto Market Testing Resistance

The crypto market has increased by over 5% and is nearing the $2.9 trillion. The…

10 hours ago

Gold Wave Analysis – 19 March 2025

Gold: ⬆️ Buy - Gold continues daily uptrend - Likely to rise to resistance level…

1 day ago