Categories: Technical analysis

Royal Dutch Shell Wave Analysis – 1 December, 2021

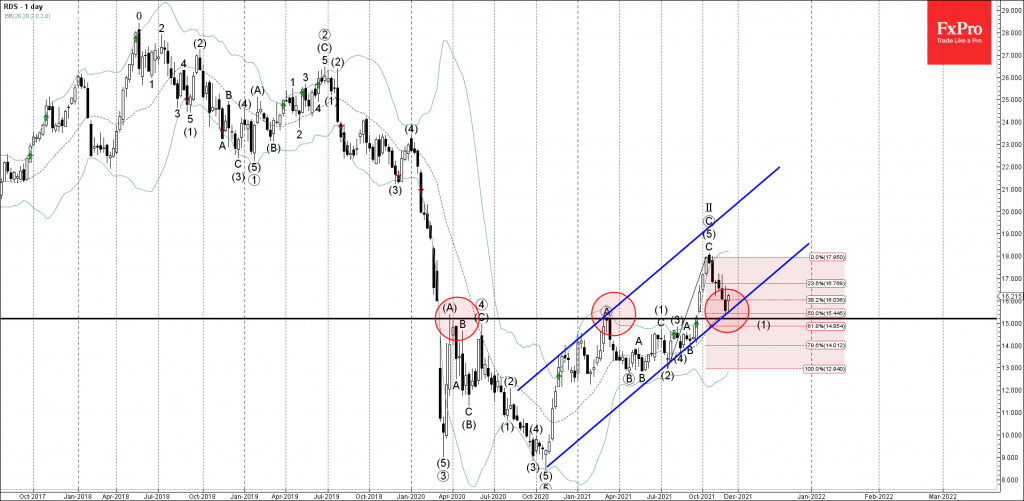
• Royal Dutch Shell reversed from support level 15.00

• Likely to rise to resistance level 17.00


Royal Dutch Shell recently reversed up from the support level 15.00 intersecting with the lower daily Bollinger Band and the support trendline of the daily up channel from October.

The support zone near the support level 15.00 was further strengthened by the 50% Fibonacci correction of the upward impulse from the start of July.

Royal Dutch Shell can be expected to rise further toward the next resistance level 17.00. Strong support remains at the support level 15.00.

The FxPro Tech Analysis Team

The FxPro technical experts prepare a daily analysis of the most active currency pairs (majors, crosses, exotics) and commodities. Selected instruments are reviewed on daily trends (D1, H4), using the active Elliott Wave setups, Japanese candlesticks, indicators, and support/resistance levels.

Share
Published by
The FxPro Tech Analysis Team

Recent Posts

AUDJPY Wave Analysis – 5 December 2025

AUDJPY: ⬆️ Buy - AUDJPY broke long-term resistance level 102.30 - Likely to rise to…

3 hours ago

Aptos Wave Analysis – 5 December 2025

Aptos: ⬇️ Sell - Aptos testing major support at 1.688 - Likely to fall to…

3 hours ago

Pro News Weekly: Market Shake-Up, Dollar Drops, Gold Surges, Bitcoin Wobbles!

Welcome to Pro News Flash! 💵 The U.S. dollar slips 🏆 Major stock indices struggle…

9 hours ago

Solana Wave Analysis – 5 December 2025

Solana: ⬇️ Sell - Solana reversed from resistance zone - Likely to fall to support…

10 hours ago

EURAUD Wave Analysis – 5 December 2025

EURAUD : ⬇️ Sell - EURAUD broke the support level 1.7600 - Likely to fall…

10 hours ago

Forex has set its priorities

In 2026, experts favour the yen, see modest euro growth, and expect pressure on the…

14 hours ago

This website uses cookies