
Qualcomm: ⬆️ Buy
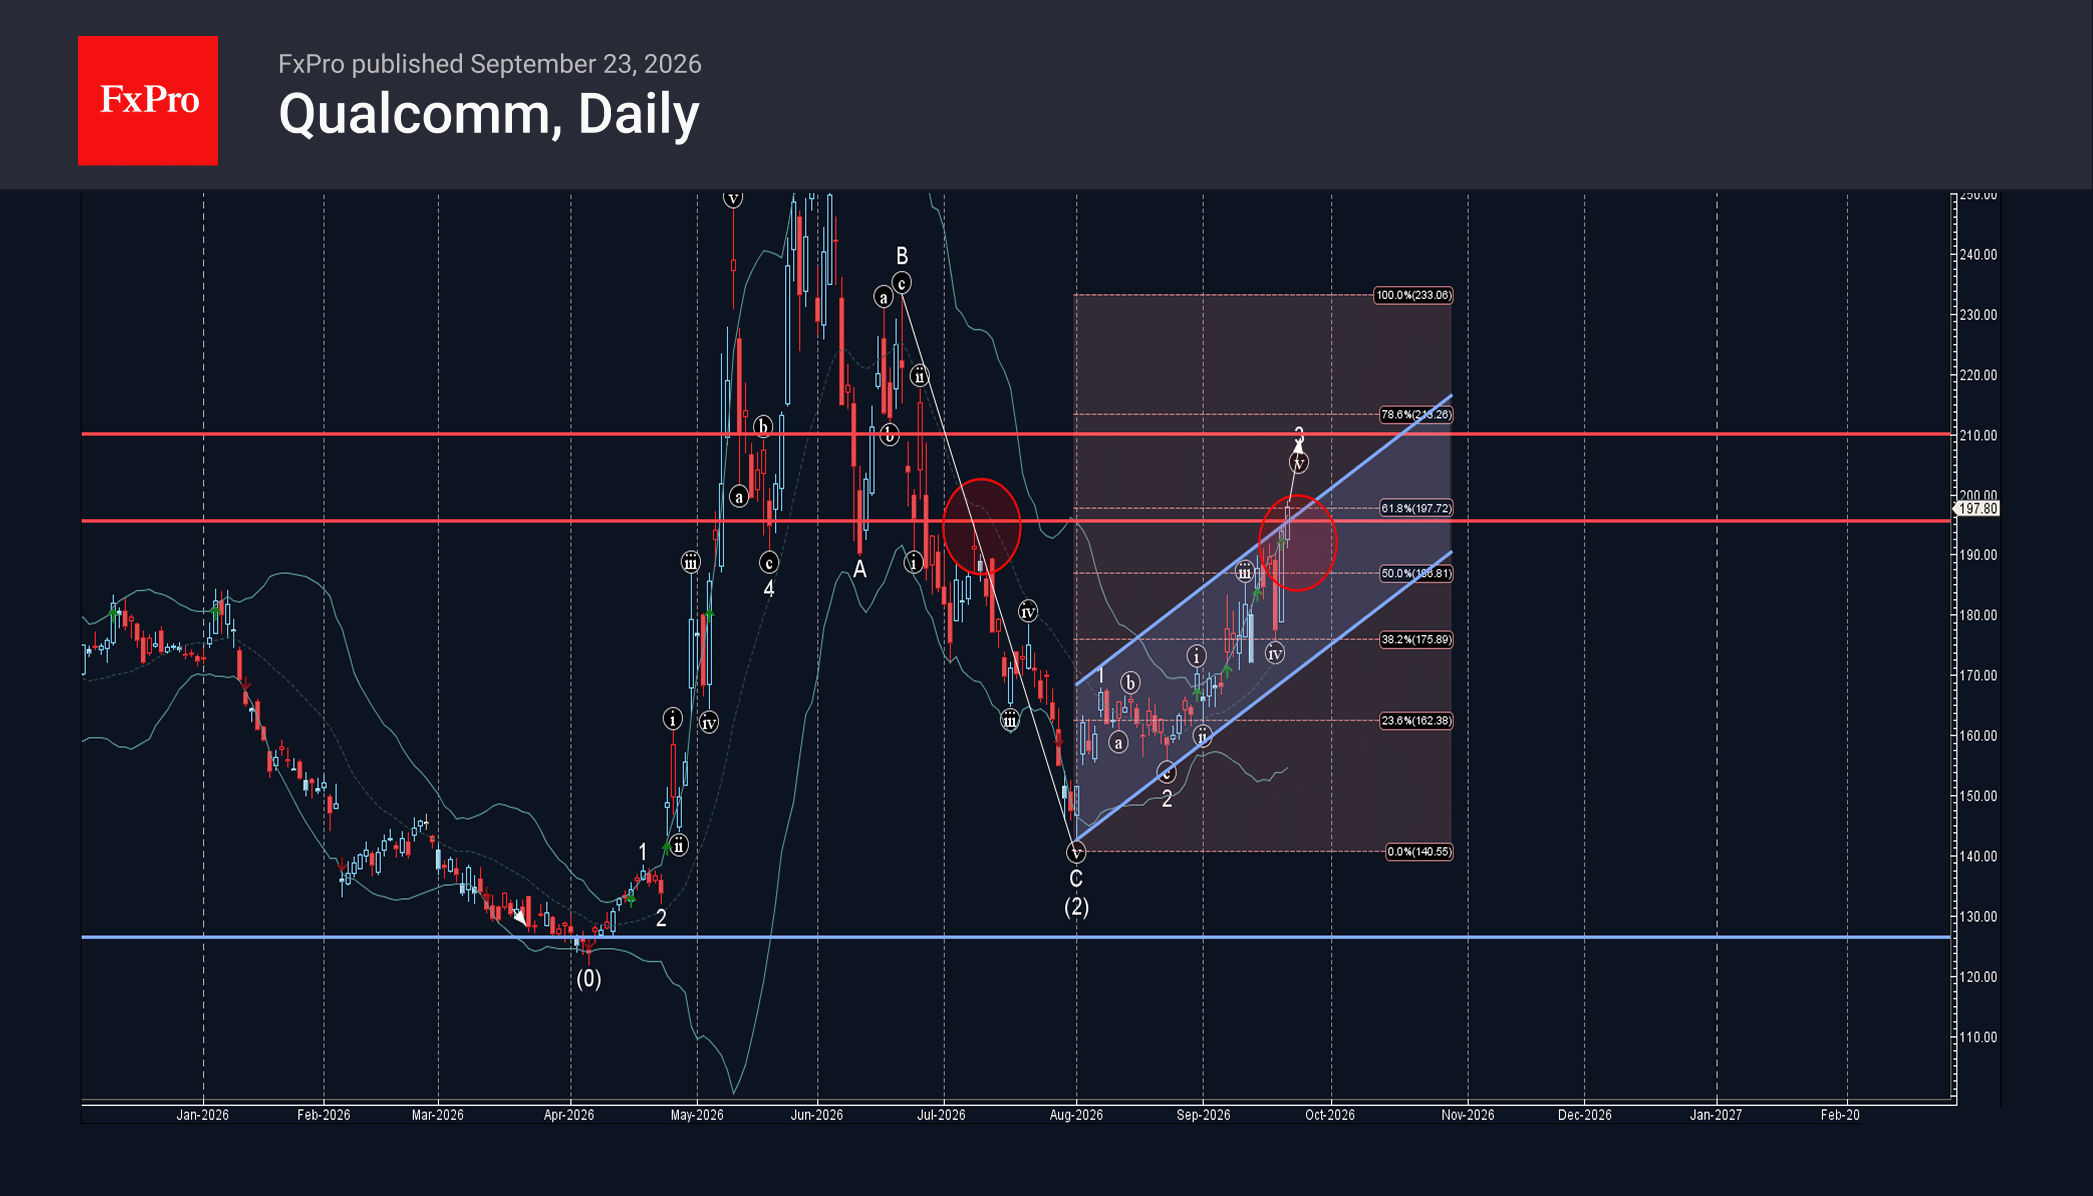
– Qualcomm broke resistance level 197.80
– Likely to rise to resistance level 210.00
Qualcomm (QCOM) stock recently broke through the resistance zone located between the resistance level 195.60, 61.8% Fibonacci correction of the downward impulse C from June and the resistance trendline of the daily up channel from August.
The breakout of this resistance zone accelerated the active minor impulse wave 3 of the intermediate impulse wave (3) from August.
QCOM stock can be expected to rise further toward the next resistance level 210.00 – target for the completion of the active impulse wave 3.