Categories: Technical analysis

Qualcomm Wave Analysis – 10 December 2025

Qualcomm: ⬆️ Buy

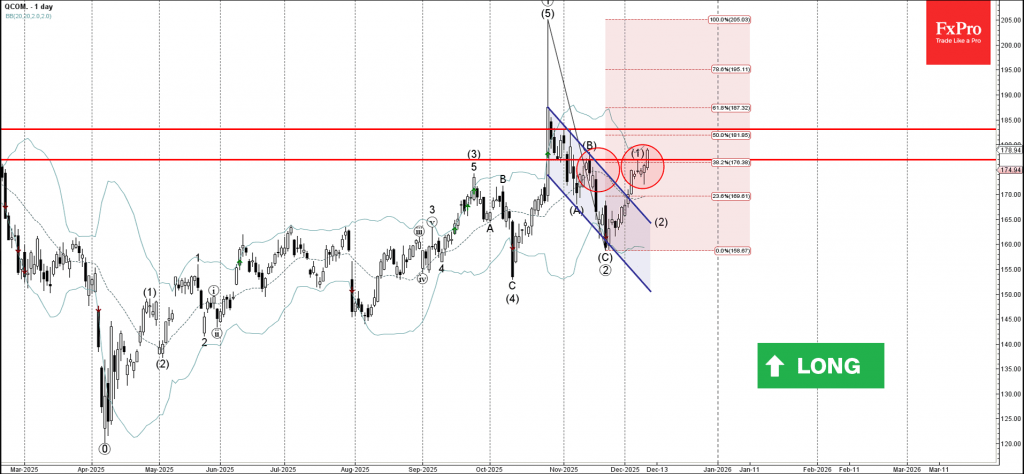
– Qualcomm broke strong resistance level 177.00

– Likely to rise to resistance level 183.00

Qualcomm recently broke the resistance area between the strong resistance level 177.00 (top of the previous wave (B)) and the 38.2% Fibonacci correction of the downward ABC correction 2 from October.

The breakout of this resistance area should accelerate the active intermediate impulse wave (1).

Given the clear daily uptrend, Qualcomm can be expected to rise to the next resistance level 183.00 (former monthly high from November).

The FxPro Tech Analysis Team

The FxPro technical experts prepare a daily analysis of the most active currency pairs (majors, crosses, exotics) and commodities. Selected instruments are reviewed on daily trends (D1, H4), using the active Elliott Wave setups, Japanese candlesticks, indicators, and support/resistance levels.

Share
Published by
The FxPro Tech Analysis Team
Tags: Qualcomm

Recent Posts

Platinum Wave Analysis – 8 January 2026

Platinum: ⬇️ Sell - Platinum reversed from pivotal resistance level 150.00 - Likely to fall to…

13 hours ago

Baidu Wave Analysis – 8 January 2026

Baidu: ⬇️ Sell - Baidu reversed from resistance zone - Likely to fall to support level…

13 hours ago

EURUSD Wave Analysis – 8 January 2026

EURUSD: ⬇️ Sell - EURUSD broke daily up channel - Likely to fall to support…

14 hours ago

WTI crude oil Wave Analysis – 8 January 2026

WTI crude oil: ⬆️ Buy - WTI crude oil reversed from support zone - Likely…

15 hours ago

Do not underestimate dollar

Positive macro statistics for the US are helping the greenback. Gold could rise to $4,610…

22 hours ago

Crypto fails to find support for a breakout

Crypto markets fell amid caution; Bitcoin and Ethereum face technical and investor shifts, with privacy…

22 hours ago

This website uses cookies